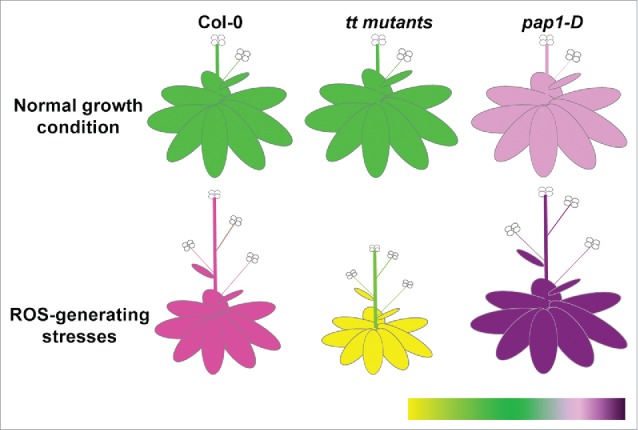
Figure 1.

General phenotypic responses of anthocyanin mutants under different growth conditions. The color heatmap on the right-bottom corner represents the color change of the plant under different growth conditions. Green colour indicates the optimal growth status of the plants. Yellow colour indicates the sensitivity of plants to stress. Different intensity of purple indicates various levels of anthocyanin accumulation. The relative plant size reflects the relative sensitivity of plants to different growth condition.
