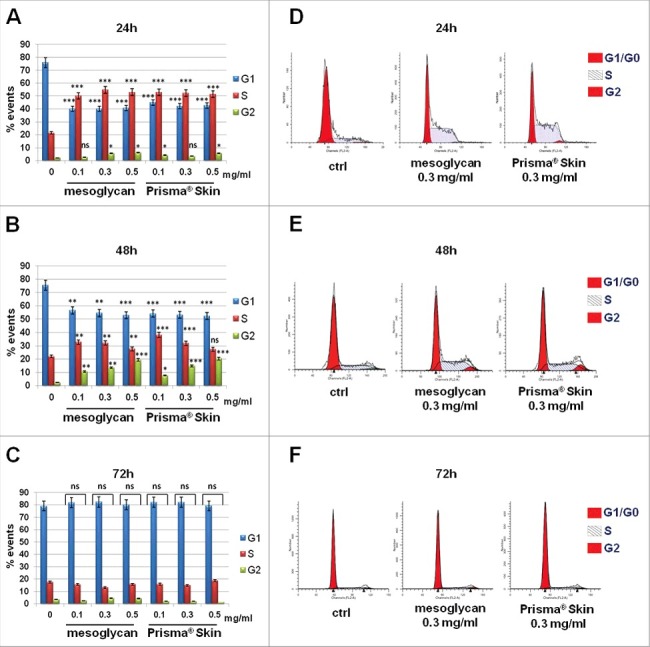
Figure 2.

BJ cycle analysis with PI staining. The histograms are representative of (A) 24 h, (B) 48 h and (C) 72 h of culture, after 24 h serum starvation. Cell cycle phase distributions of fibroblasts analyzed by ModFit LT software at (D) 24 h, (E) 48 h and (F) 72 h after treatment with sodium mesoglycan and Prisma® Skin. The data are representative as a mean of 3 experiments with similar results, statistical analyses for significance of results were performed using Student's t-test, assuming a 2-tailed distribution and unequal variance. *p < 0.05, **p < 0.01, ***p < 0.001, ns p > 0.05.
