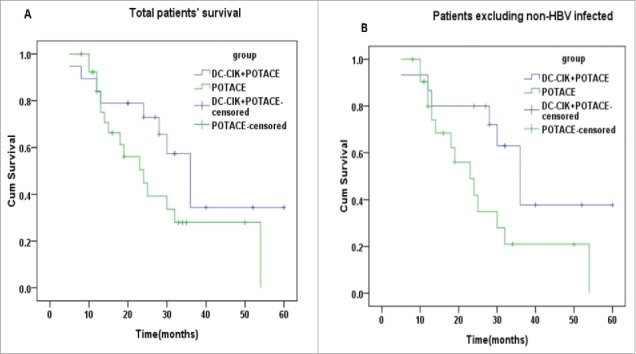
Figure 1.

The prognosis of DC-CIK cell therapy for patients treated by POTACE. (A) The overall survival curves of total patients with HCC undergoing POTACE alone and POTACE plus DC-CIK cell therapy, respectively (n = 46, log rank, p = 0.118). (B) The overall survival curves of HCC patients without of HBV-infection undergoing POTACE alone (n = 22) and POTACE plus DC-CIK cell therapy (n = 15), respectively (log rank, p = 0.044). The Kaplan-Meier curves were used to analyze the OS of patients, log-rank test was used to check the significant difference between two groups; P < 0.05 signified statistical significance; blue and green line represents the low and high expression of PD-L1, respectively. Plus sign (+) on the line represents censored data.
