
Figure 2.
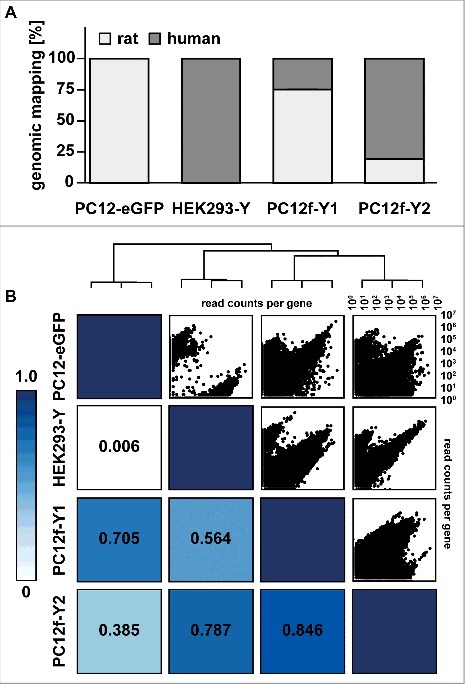
Transcriptomic analysis of the parental and fusion cells. The transcriptome of the parental and fusion cells were paired end sequenced (2 × 101bp). (A) Mapping of the sequencing reads to rat and human genome. A higher fraction of reads originating from PC12f-Y1 cells map to the rat genome (derived from the PC12-eGFP) where reads originating from PC12f-Y2 cells mainly map to the human genome (derived from HEK293-Y). (B) Scatter and heatmap correlation plot of read counts per gene comparing the four cell lines. PC12f-Y1 and PC12f-Y2 have the highest correlation. Beyond that PC12f-Y1 clusters with PC12-eGFP and PC12f-Y2 with HEK293-Y cells.