. 2018 Mar 20;7:e33221. doi: 10.7554/eLife.33221

Figure 2. FACS purification and transcriptional profiling identifies molecules expressed in neoblasts and cells associated with the tegumental lineage.

(A) Cartoon depicting FACS purification strategy. (B) FACS plots showing various cell populations in control and following gamma-irradiation. Percentages represent fraction of the number of cells in the boxed region over the total number of live cells. (C) Confocal micrographs of the sorted cell populations labeled with Hoechst and an anti-TSP-2 antibody. (D) Heatmap showing clustering analysis of genes expressed in the indicated cell populations. Inset shows TSP-2 enriched clusters. (E) Heatmap showing the relative expression of individual genes in each cell population. These genes are organized by cluster. (F) Cartoon depicting the approximate regions imaged in panel G. (G) Maximum intensity projection of z-stacks acquired either at superficial levels (‘Surface’) or deeper in the parasite tissue (‘Parenchyma’). The gene expression cluster of each gene examined is listed on the right. Scale bars: 10 µm.

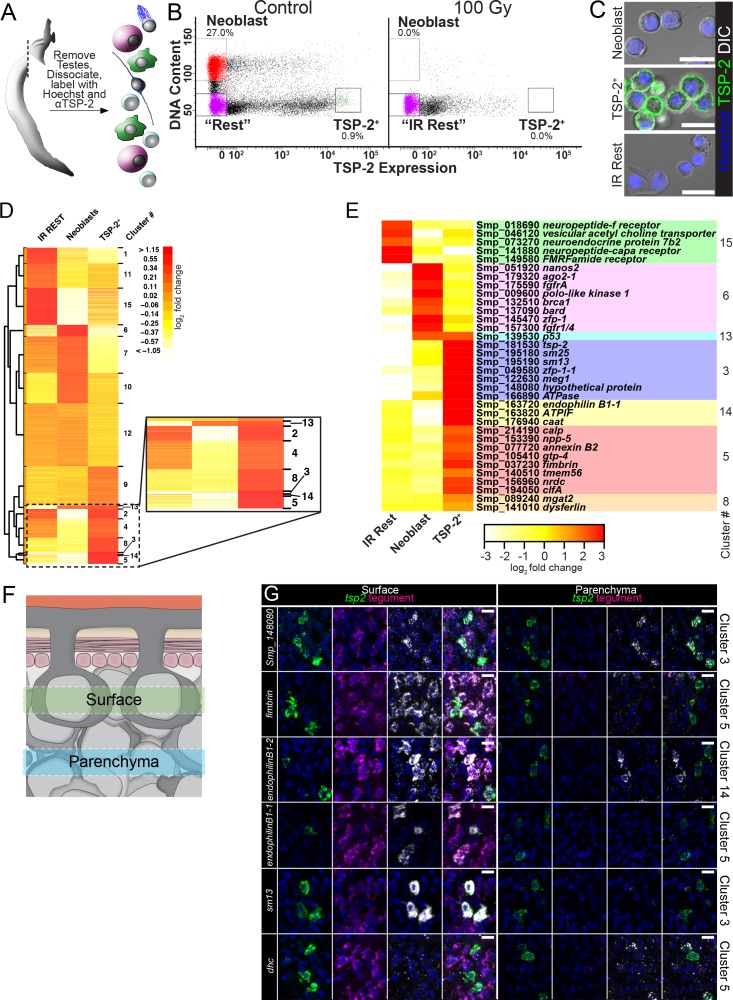
Figure 2.

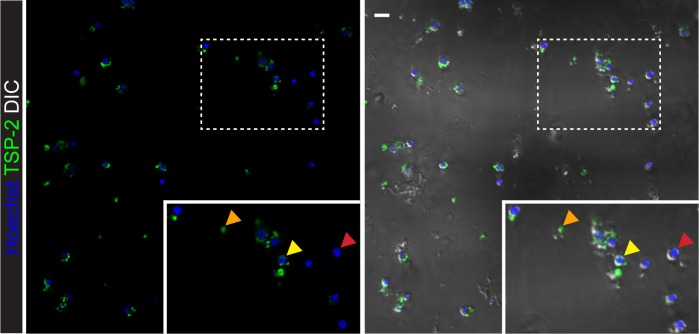
Figure 2—figure supplement 1. Microscopic imaging of sorted ‘TSP-2 Intermediate’ cells.

Figure 2—figure supplement 1.

Confocal images of sorted TSP-2 Intermediate cells. Arrows in the inset show cells with no TSP-2 labeling (red arrows), cells with pieces of TSP-2+ debris attached to them (yellow arrows), and acellular debris (orange arrows). Scale bar: 10 µm.
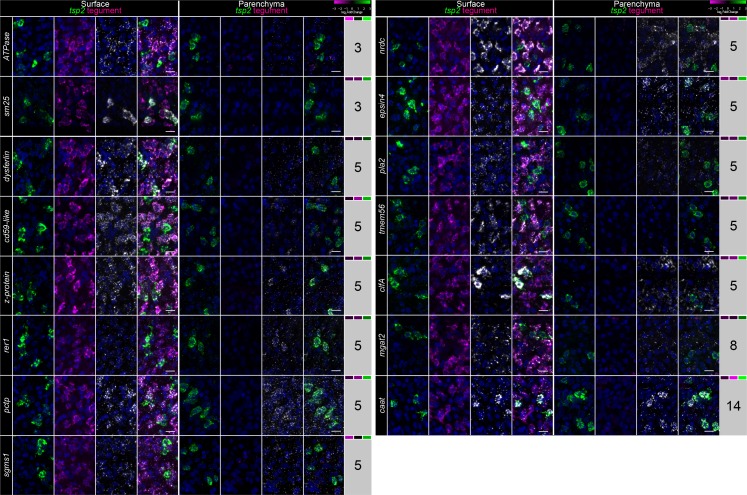
Figure 2—figure supplement 2. Examination of the expression of genes expressed in TSP-2-enriched clusters.

Figure 2—figure supplement 2.

FISH for tsp-2, a mixture of tegumental makers (Tegument), and panel of 15 genes from various clusters of gene expression (indicated at right of the image). Relative expression levels of each gene in IR Rest, Neoblasts, and TSP-2+ cells are indicated in the heatmap to the right, respectively. Images are maximum intensity projections at either the level of the surface (left) or in the parenchyma (right). See Figure 2F for definition of ‘surface’ and ‘parenchyma’. Scale bars: 10 µm.
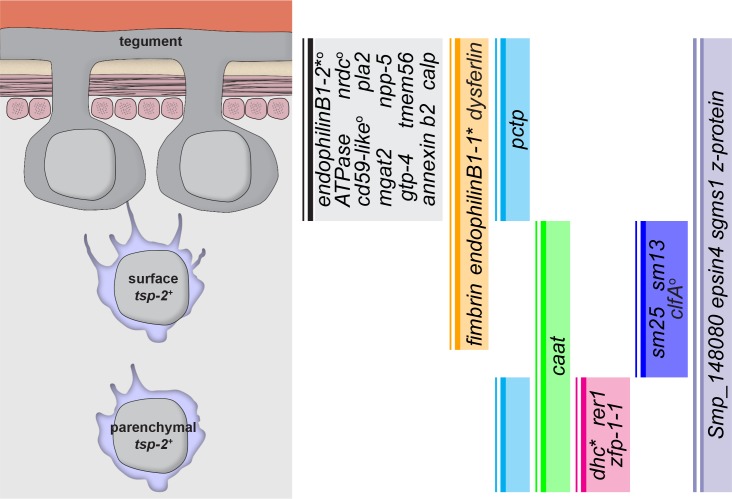
Figure 2—figure supplement 3. Graphical summary of genes expressed in TSP-2-enriched clusters.

Figure 2—figure supplement 3.

A graphical summary indicating where in the tegumental lineage genes are expressed. An asterisk next to a gene name indicates that the gene is only expressed in a subset of the population. A superscript ‘O’ next to a gene name indicates that the gene is also expressed in cells not in the proposed tegument lineage.