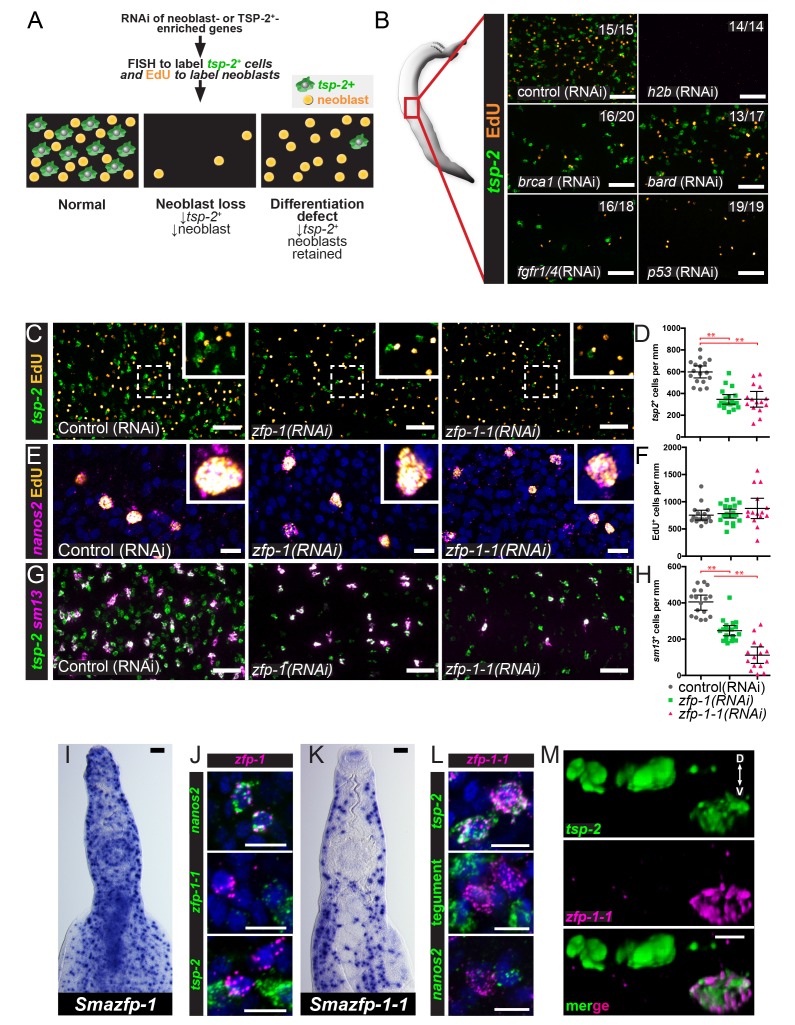
Figure 3. An RNAi screen identifies zfp-1 and zfp-1–1 as genes required for the production of tsp-2+ cells.
(A) Cartoon depicting the RNAi screening strategy used to identify regulators of tegument progenitor specification. Candidate genes were knocked-down using RNAi, worms were pulsed with EdU for 4 hrs and then fixed. Neoblasts and tegument progenitor cells were observed using EdU detection and tsp-2 RNA FISH, respectively. (B) Results of control RNAi experiments. Negative control RNAi preserves tsp-2 cells and neoblasts whereas h2b RNAi results in a loss of neoblasts and tsp-2 cells. brca1, bard, fgfr1/4, and p53 RNAi results in a partial depletion of neoblasts and a proportional decrease in tsp-2+cells. Representative maximum intensity confocal projections are shown. Numbers represent the fraction of parasites displaying the observed phenotype. (C) Maximum intensity projection showing tsp-2 expression and EdU incorporation in zfp-1(RNAi) or zfp-1-1(RNAi) parasites. (D) Quantification of the number of tsp-2+ cells per mm of worm. Control(RNAi) n = 17, zfp-1(RNAi) n = 19, zfp-1-1(RNAi) n = 15. (E) Maximum intensity projection showing nanos2 expression and EdU incorporation in zfp-1(RNAi) or zfp-1-1(RNAi) parasites. (F) Quantification of the number of EdU+ cells per mm worm. Control(RNAi) n = 17, zfp-1(RNAi) n = 19, zfp-1-1(RNAi) n = 15. (G) Maximum intensity projection showing tsp-2 and sm13 expression in zfp-1(RNAi) or zfp-1-1(RNAi) parasites. (H) Quantification of the number of sm13+ cells per mm worm. Control(RNAi) n = 17, zfp-1(RNAi) n = 19, zfp-1-1(RNAi) n = 15. (I) WISH showing zfp-1 expression in adult male worm. (J) Double FISH showing expression of zfp-1 relative to nanos2 (a neoblast marker), zfp-1–1, and tsp-2. (K) WISH showing zfp-1–1 expression in adult male worm. (L) Double FISH showing expression of zfp-1–1 relative to tsp-2, a mixture tegument-specific markers (tegument), and nanos2 (a neoblast marker). (M) 3D rendering showing expression of zfp-1–1 in a subset of tsp-2+ cells. The dorsal and ventral surfaces of the animal are oriented towards the top and the bottom of the image, respectively, as indicated by the arrows in the first panel. Scale bars: B, C, G, I, K 50 µm; E, J, L, M 10 µm. Error bars represent 95% confidence intervals, **p<0.01 (Student’s t-test).


