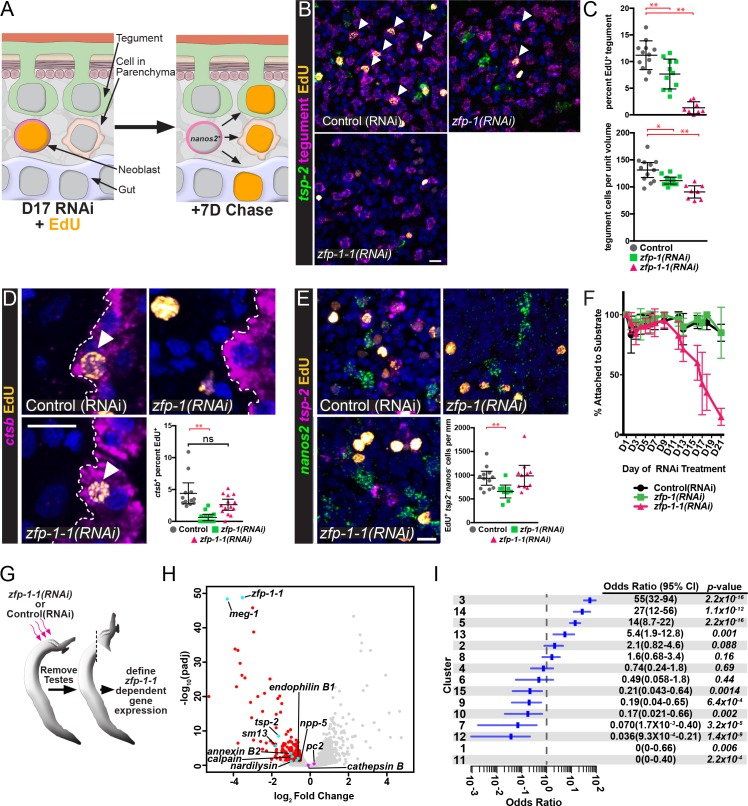
Figure 5. ZFP-1 family proteins are required for the production of new tegumental cells.
(A) Cartoon depicting the strategy for fate-mapping by EdU pulse-chase experiments. (B) FISH for tsp-2 and tegumental markers with EdU detection in zfp-1(RNAi) or zfp-1-1(RNAi) parasites at day seven following an EdU pulse. Arrows represent EdU+ tegumental cells. (C) (Top) Quantification of the percentage of tegumental cells that are EdU+ following a 7 day chase period and (Bottom) tegumental cell density in zfp-1(RNAi) or zfp-1-1(RNAi) parasites. Control(RNAi) n = 12, zfp-1(RNAi) n = 11, zfp-1-1(RNAi) n = 8. (D) FISH for cathepsin B and EdU detection in zfp-1(RNAi) or zfp-1-1(RNAi) parasites at day seven following an EdU pulse. Plot represents the percentage of cathepsin B + cells that are EdU+. Control(RNAi) n = 12, zfp-1(RNAi) n = 13, zfp-1-1(RNAi) n = 14. (E) FISH for nanos2 and tsp-2 with EdU detection in zfp-1(RNAi) or zfp-1-1(RNAi) parasites at day seven following an EdU pulse. Plot represents the number of tsp-2- EdU+ differentiated cells (i.e., nanos2- cells) per mm of parasite length. Control(RNAi) n = 12, zfp-1(RNAi) n = 10, zfp-1-1(RNAi) n = 11. (F) Percentage of the parasites that remain attached to the culture dish at the indicated time point following the first RNAi treatment. n = 5 experiments with approximately 10 worms per RNAi treatment in each experiment. (G) Cartoon depicting strategy for examining transcriptional changes following zfp-1–1 RNAi. (H) Volcano plot showing differentially expressed genes in zfp-1-1(RNAi) worms. Red dots represent genes that are down regulated (−0.5 log2 fold change, padj <0.05) in zfp-1-1(RNAi) worms. Cyan dots indicate genes known to be expressed in the tegument lineage. Magenta dots indicate genes validated to be expressed in differentiated cells. (I) Plot showing odds-ratio (i.e., the relative over- or under-representation) of genes from gene expression clusters among genes down regulated following zfp-1–1 RNAi. Blue rectangles depict the odds-ratio from a Fisher’s Exact Test, whereas blue lines indicate the 95% confidence intervals. Values of odds-ratio and p-values for Fisher’s Exact Test shown to right. No genes from expression clusters 1 or 11 were down-regulated following zfp-1–1 RNAi, so no odds ratio was calculated. From these data, genes from expression clusters 3, 5, 13 and 14 are over-represented (p<0.05), whereas genes from clusters 1, 7, 9, 11, 12, and 15 appear under-represented. Scale bars: 10 µm. Error bars in (C–E) represent 95% confidence intervals, error bars in (F) represent standard deviation. *p<0.05; **p<0.01; ns, not significant (Student’s t-test).

