
Figure 3. RMSF of complete capsid.
(a) Average Cα RMSF (Å) of Cp dimers. Calculations are based on internal alignment of dimers extracted from the capsid simulation (local dynamics, bottom curve) and alignment of the full capsid (global dynamics, top curve), totaling 120 µs of conformational sampling. The increase in apparent dimer flexibility in the latter case arises from spatial movements of dimers relative to each other within the capsid assembly. (b) Projection of RMSF values fonto their corresponding locations in the capsid model instead of averaging over dimer copies reveals clear asymmetry in global dynamics. Fivefold vertices are highlighted with stars.
Figure 3—source data 1. Raw data for plot 3a in plain text format.
elife-32478-fig3-data1.txt (11.7KB, txt)
DOI: 10.7554/eLife.32478.010
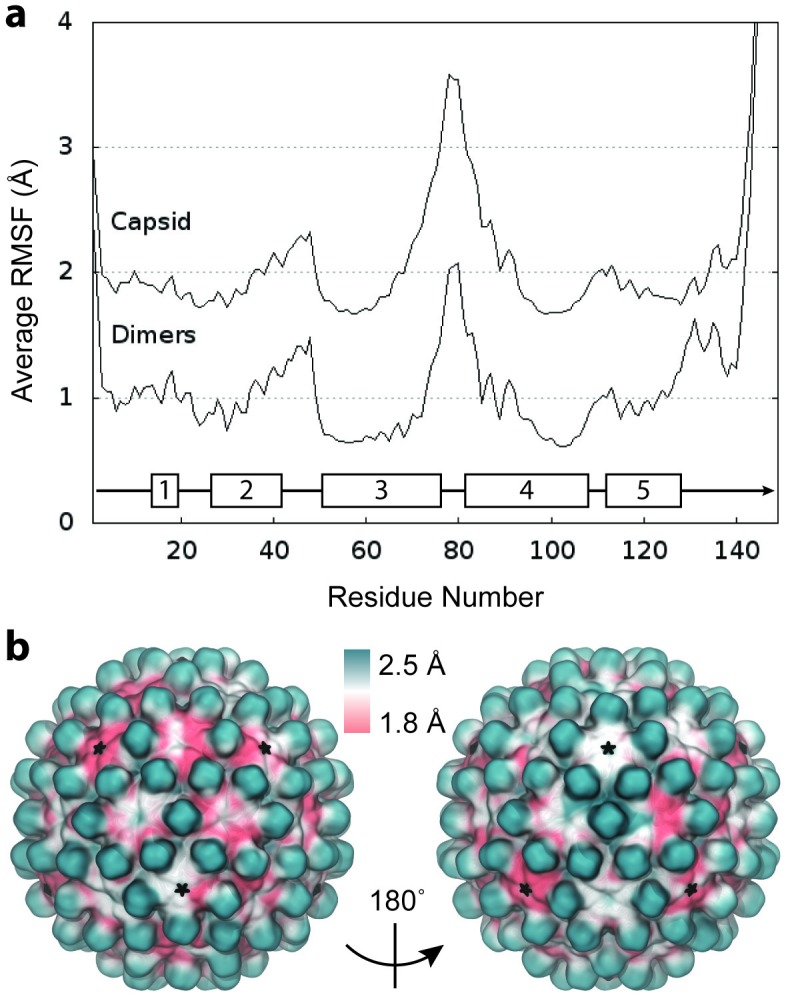
Figure 3—figure supplement 1. Deviations in transformations between dimers of neighboring subunits.
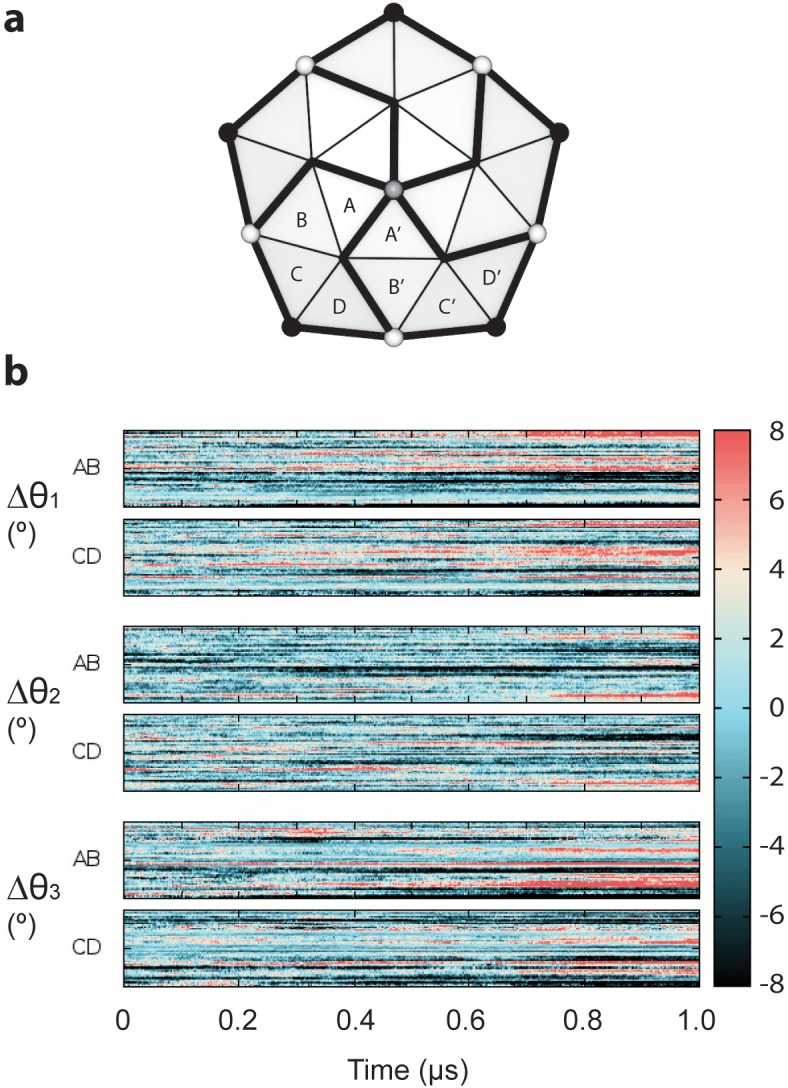
(a) Schematic showing the relationship of capsid chains around a fivefold symmetry axis. A given set of Euler angles θ1, θ2, and θ3 transform the dimers composed of chains AB and CD to their neighbors A’B’ and C’D’. (b) The Euler angles required to transform the chains AB and CD to their neighbors A’B’ and C’D’ show deviations in excess of ±8° relative to the idealized structure. These altered Euler angles produce deviations in displacements of neighboring chains up to ±8 Å compared to a symmetric structure.