
Figure 5. Essential dynamics of the capsid.
(a–f) Views of the first mode from PCA, which comprises only 6% of total variance, illustrate the striking complexity and intrinsic asymmetry of capsid dynamics. PCA calculation based on Cα trace of 50,000 conformations sampled over 1 µs of simulation. Mode representation shown as a porcupine plot projected onto a polyhedral surface with pentamers highlighted in red; eigenvalue scaling increased by five for visual clarity.
Figure 5—source data 1. Mode data in plain text format for NMWiz.
elife-32478-fig5-data1.txt (2.3MB, txt)
DOI: 10.7554/eLife.32478.015

Figure 5—figure supplement 1. Scree plot for PCA modes.
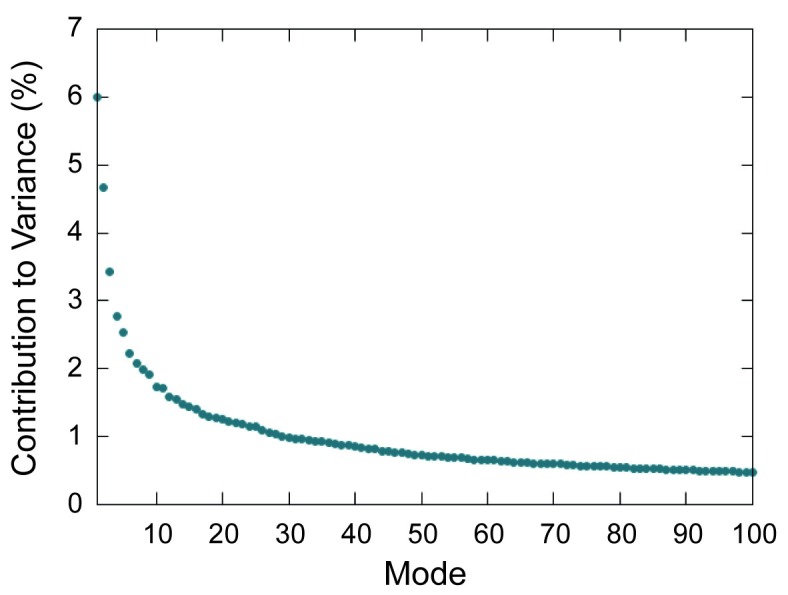
Scree plot showing percent contribution to total variance for the first 100 modes determined by PCA of the capsid.