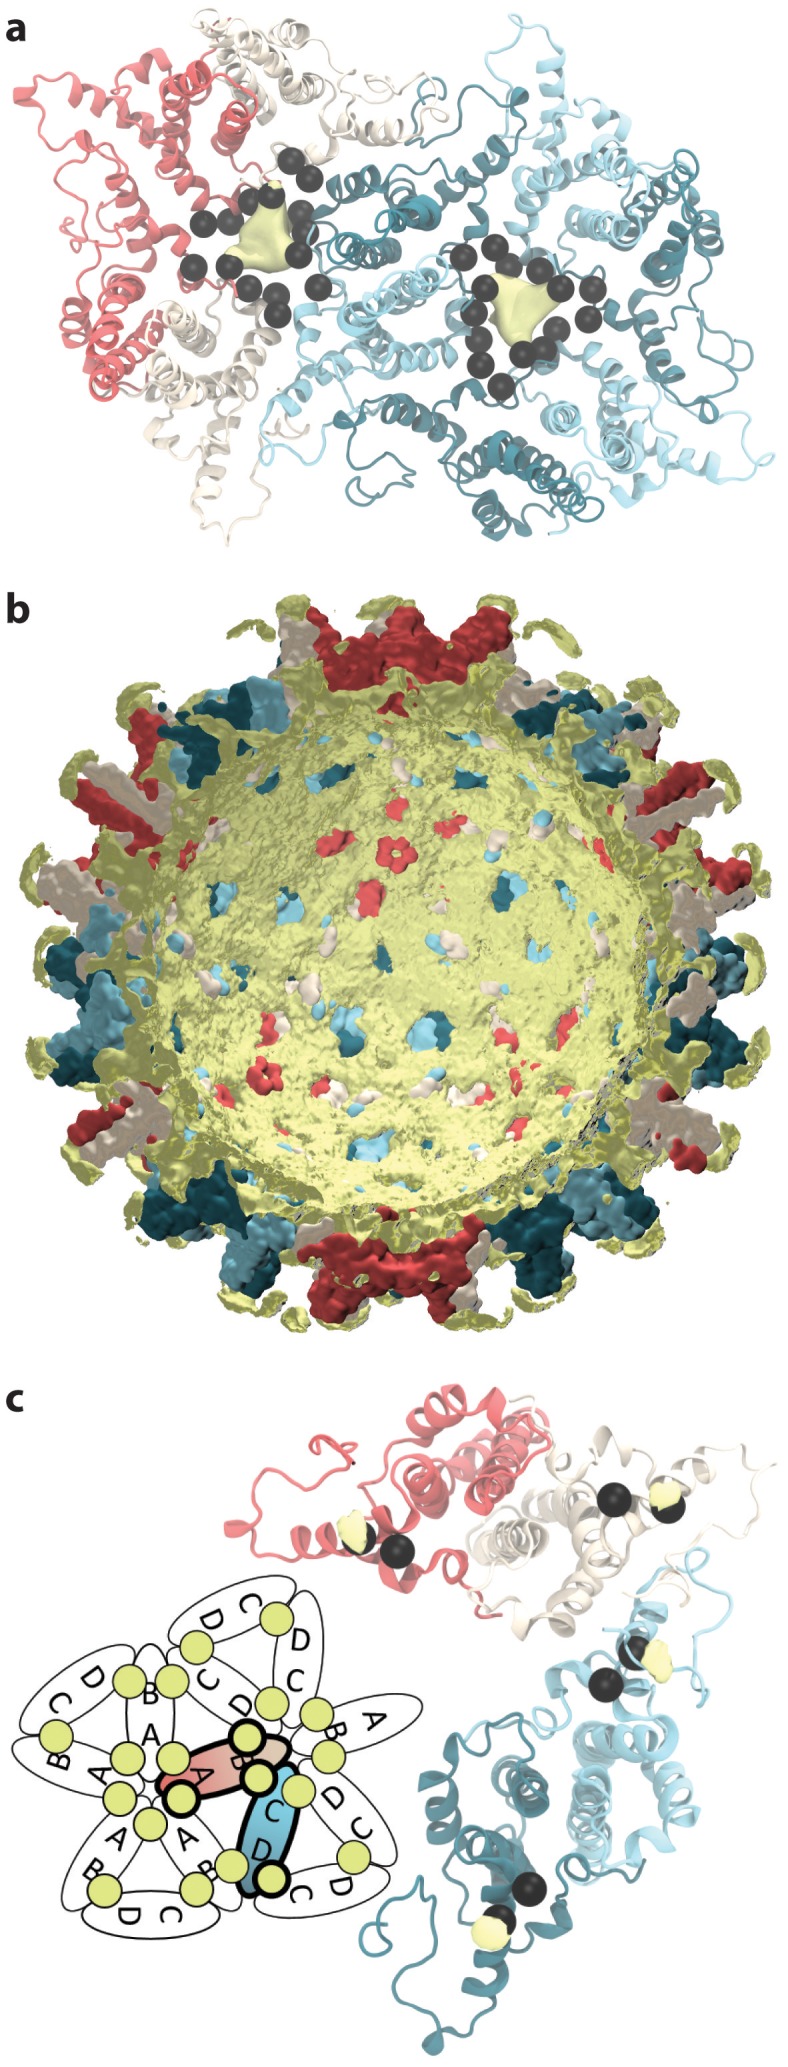
Figure 9. Sodium ion occupancy.
(a) View of two AB and three CD dimers from the capsid exterior, illustrating sodium ion localization (yellow) within the pores at the center of trimers of dimers, where three copies each of D2, D4, E14, D40, and E43 (black spheres) aggregate. Isosurface contour level at ΔG = −1.0 kcal mol-1. Calculation based on alignment of 60 asymmetric units with surrounding solvent, totaling 60 µs of conformational sampling. (b) Cross-section of the capsid showing sodium ion localization (yellow) in a shell along the interior and in arcs above the spike tips. Isosurface contour level at ΔG = −0.5 kcal mol-1. Calculation based on alignment of full capsid with surrounding solvent, totaling 1 µs of conformational sampling. (c) View of the asymmetric unit from the capsid interior, illustrating sodium binding (yellow) at E117, adjacent to E113 (black spheres). Isosurface contour level at ΔG = −1.4 kcal mol-1. Calculation based on alignment of 60 asymmetric units with surrounding solvent, totaling 60 µs of conformational sampling. Inset: Schematic showing sodium binding locations within extended capsid lattice. ΔG error estimates are all within 4×10⁻⁵ kcal mol-1.

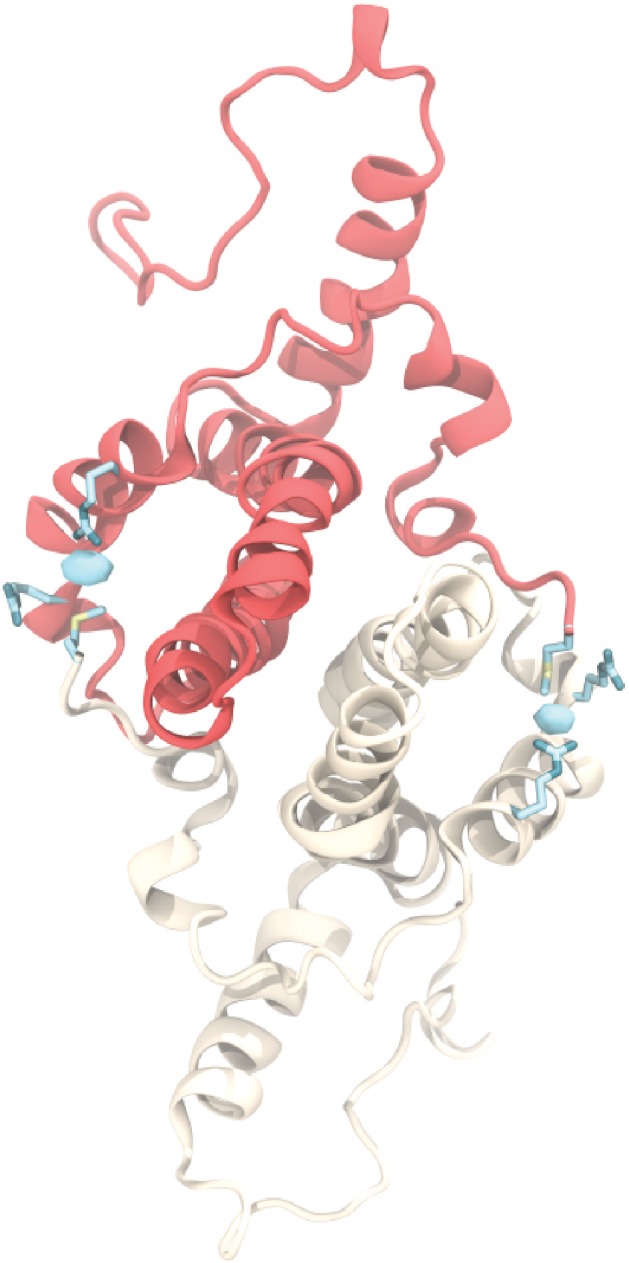
Figure 9—figure supplement 1. Chloride ion occupancy.

