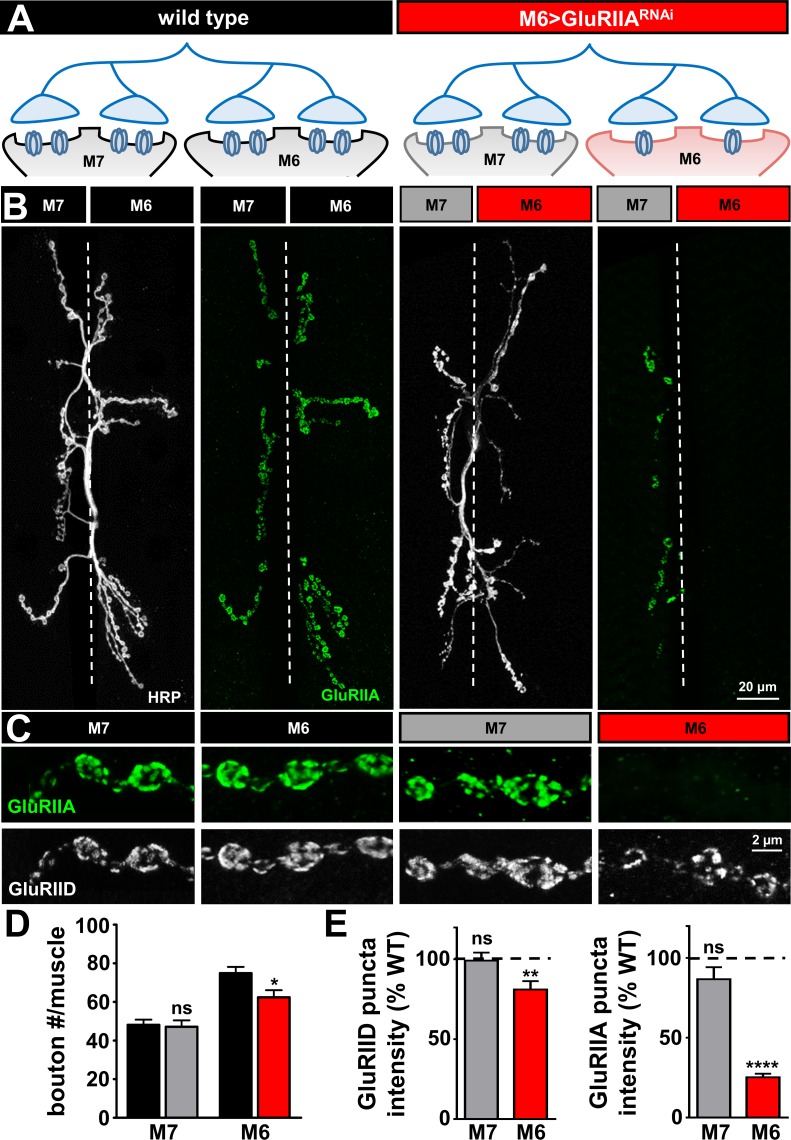
Figure 2. GluRIIA-containing receptors can be knocked down specifically on muscle six using M6 >Gal4.
(A) Schematic of the Type Ib motor neuron innervating both muscles 6 and 7 at the Drosophila NMJ. Gal4 is expressed specifically on muscle six in combination with UAS-GluRIIARNAi using M6 > Gal4 (M6 > GluRIIARNAi: w1118;Tub-FRT-STOP-FRT-Gal4, UAS-FLP, UAS-CD8-GFP/+; H94-Gal4, nSyb-Gal80/UAS-GluRIIARNAi). GluRIIA expression is reduced on muscle 6, while expression of GluRIIA on muscle 7 is unperturbed. (B) Representative images of muscle 6/7 NMJs immunostained with antibodies that recognize the neuronal membrane (HRP) and the postsynaptic GluR subunit GluRIIA in wild type and M6 > GluRIIARNAi. (C) Representative images of individual Ib synaptic boutons immunostained with anti-GluRIIA and anti-GluRIID on the indicated muscles in wild type and M6 > GluRIIARNAi. (D) Quantification of bouton numbers on muscles 6 and 7 in wild type and M6 > GluRIIARNAi. (E) Quantification of mean fluorescence intensity of GluRIIA and GluRIID puncta normalized to wild type on the indicated muscles. Asterisks indicate statistical significance using a Student’s t test: (*) p<0.05; (**) p<0.01; (****) p<0.0001, (ns) not significant. Error bars indicate ± SEM. Detailed statistical information for represented data (mean values, SEM, (n, p) is shown in Supplementary file 1.


