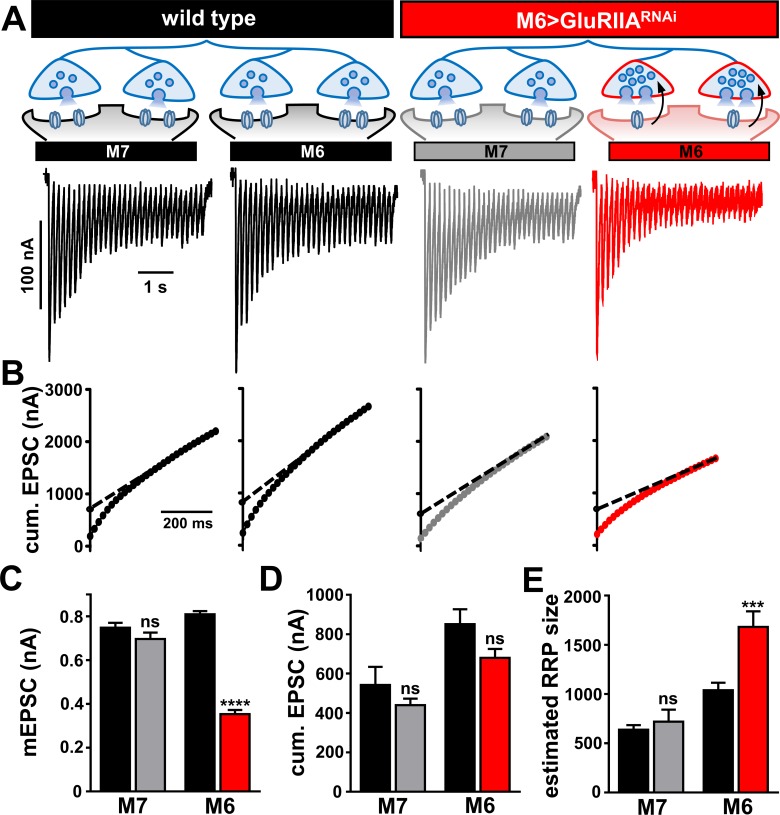
Figure 5. Homeostatic modulation of the readily releasable vesicle pool is restricted to synapses innervating muscle 6 at M6 >GluRIIARNAi NMJs.
(A) Schematic illustrating the size of the RRP is enhanced specifically at the terminals innervating muscle six in M6 > GluRIIARNAi. Representative traces of two-electrode voltage clamp recordings (30 stimuli at 60 Hz in 3 mM extracellular Ca2+) from muscles 7 or 6 in the indicated genotypes. (B) Averaged cumulative EPSC amplitude plotted as a function of time. A line fit to the 18-30th stimuli was back-extrapolated to time 0. (C–E) Quantification of mEPSC amplitude (C), average cumulative EPSC values (D), and estimated readily releasable pool (RRP) sizes (E) for the indicated muscles and genotypes. Note that RRP size is significantly increased at muscle 6 NMJs, but no change is observed at muscle 7. Error bars indicate ± SEM. Asterisks indicate statistical significance using a Student’s t test: (*) p<0.05; (***) p<0.001; (ns) not significant. Detailed statistical information for represented data (mean values, SEM, n, p) is shown in Supplementary file 1.

