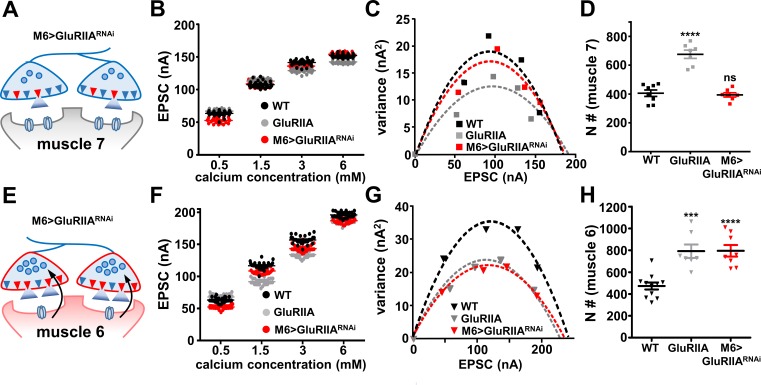
Figure 6. The number of functional release sites are specifically enhanced at synapses innervating muscle 6 at M6 >GluRIIARNAi NMJs.
(A) Schematic illustrating the number of functional release sites (marked as red triangles) at synapses innervating muscle 7 of M6 > GluRIIARNAi NMJs. (B) Scatter plot EPSC distribution of recordings derived from muscle 7 of wild type, GluRIIA mutants, and M6 > GluRIIARNAi in the indicated extracellular Ca2+ concentrations. (C) Variance-mean plots for the indicated genotypes. Variance was plotted against the mean amplitude of 30 EPSCs recorded at 0.2 Hz from the four Ca2+ concentrations detailed in (B). Dashed lines are the best fit parabolas to the data points. (D) Estimated number of functional release sites (N) obtained from the variance-mean plots in (C). Note that the number of functional release sites are enhanced only at muscle 7 NMJs of GluRIIA mutants. (E) Schematic illustrating the number of functional release sites (marked as red triangles) at synapses innervating muscle 6 of M6 > GluRIIARNAi NMJs. (F) Scatter plot EPSC distribution of recordings derived from muscle 6 of wild type, GluRIIA mutants, and M6 > GluRIIARNAi in the indicated extracellular Ca2+ concentrations. (G) Variance-mean plots for the indicated genotypes. (H) Estimated number of functional release sites (N) obtained from the variance-mean plots in (G). Both GluRIIA mutants and M6 > GluRIIARNAi showed a significant enhancement of functional release site number at muscle 6 NMJs compared to wild type. Error bars indicate ± SEM. Asterisks indicate statistical significance using one-way analysis of variance (ANOVA), followed by Tukey’s multiple-comparison test: (***) p<0.001; (****) p<0.0001; (ns) not significant. Detailed statistical information for represented data (mean values, SEM, (n, p) is shown in Supplementary file 1.

