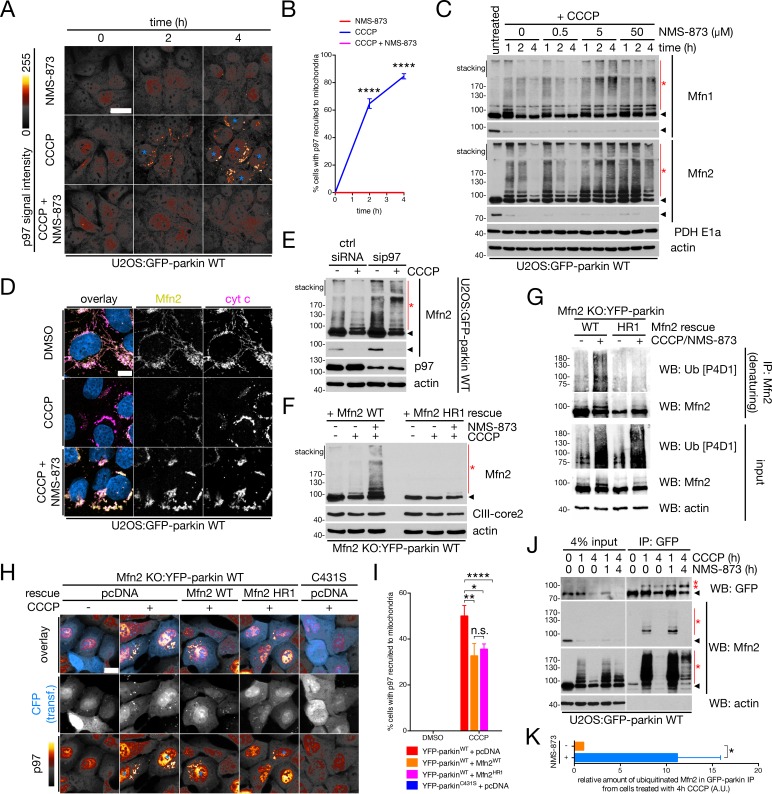
Figure 6. Degradation of ubiquitinated Mfn2 involves p97 recruitment and activity.
(A) Representative confocal images of p97 recruitment to mitochondria in cells treated with 20 μM CCCP and/or 25 μM NMS-873 for the indicated time. Blue asterisks denote cells with mitochondrial p97, and p97 signal intensity is represented as a heat map. Scale bar, 20 microns. (B) Quantification of cells with p97 translocation to mitochondria in cells treated with either 25 μM NMS-873 (red line), 20 μM CCCP (blue line) or both simultaneously (magenta line). Bars represent mean ± SEM, n = 3 replicates per condition, with >100 cells counted per condition for each replicate. ****, p<0.0001. (C) Immunoblot analysis of whole-cell lysates from U2OS:GFP-parkin cells treated with 20 μM CCCP and the specified concentration of NMS-873 for the indicated time, separated by SDS-PAGE. For each Mfn, longer (upper panel) and shorter (lower panel) exposures are shown. Red asterisks indicate ubiquitinated Mfn species, while the arrowheads denote the unmodified band. (D) U2OS:GFP-parkin cells were treated with 20 μM CCCP in the presence or absence of 25 μM NMS-873 for four hours, then fixed and immunostained for Mfn2 (yellow) and cytochrome c (magenta). Scale bar, 10 microns. (E) Immunoblot analysis of Mfn2 ubiquitination in U2OS:GFP-parkin WT cells transfected with siRNA targeting p97 (sip97) or control (ctrl siRNA) and treated with 20 μM CCCP for two hours. Arrowheads indicate the unmodified Mfn2 band (two exposures), while the red asterisk denotes ubiquitinated Mfn2. (F) Immunoblot analysis of exogenous Mfn2 in Mfn2 KO:YFP-parkin WT cells reconstituted with the indicated Mfn2 construct. Cells were treated with 25 μM NMS-873 and/or 20 μM CCCP for four hours prior to lysis. The arrowhead indicates the unmodified Mfn2 band and the red asterisk denotes ubiquitinated Mfn2 conjugates. (G) Immunoprecipitation of Mfn2 under denaturing conditions from Mfn2 KO:YFP-parkin WT cells reconstituted with the indicated Mfn2 construct. Cells were lysed in buffer containing 1% SDS (see Materials and Methods). Immunoprecipitates were separated by SDS-PAGE and immunoblotted for Ub. (H) Representative widefield images of p97 translocation to mitochondria (pseudocoloured as in [A]) in Mfn2 KO:YFP-parkin WT or C431S cells, reconstituted with the indicated plasmid, treated with 20 μM CCCP (or DMSO) for four hours. CFP (blue) is included as a marker of Mfn2 transfection, and blue asterisks indicate cells where p97 has translocated to mitochondria. Scale bar, 20 microns. (I) Quantification of mitochondrial recruitment of p97 in Mfn2 KO:YFP-parkin cells from (H). Bars represent mean ± SEM, n = 3 replicates per condition, with >50 cells counted per condition for each replicate. *, p<0.05; **, p<0.01; ****, p<0.0001. (J) Co-immunoprecipitation of mitofusins with GFP-parkin in U2OS:GFP-parkin WT cells treated with 20 μM CCCP in the presence or absence of 25 μM NMS-873 for the indicated time, using an anti-GFP antibody. Immunoprecipitates were separated, along with 4% input, by SDS-PAGE and immunoblotted for the indicated protein. The arrowhead indicates the unmodified form of the protein, while the asterisks denote ubiquitinated forms. (K) Quantification of the relative amount of ubiquitinated Mfn2 co-immunoprecipitated with GFP-parkin in cells from (J). Bars represent mean ± SEM, n = 3 replicates. *, p<0.05.


