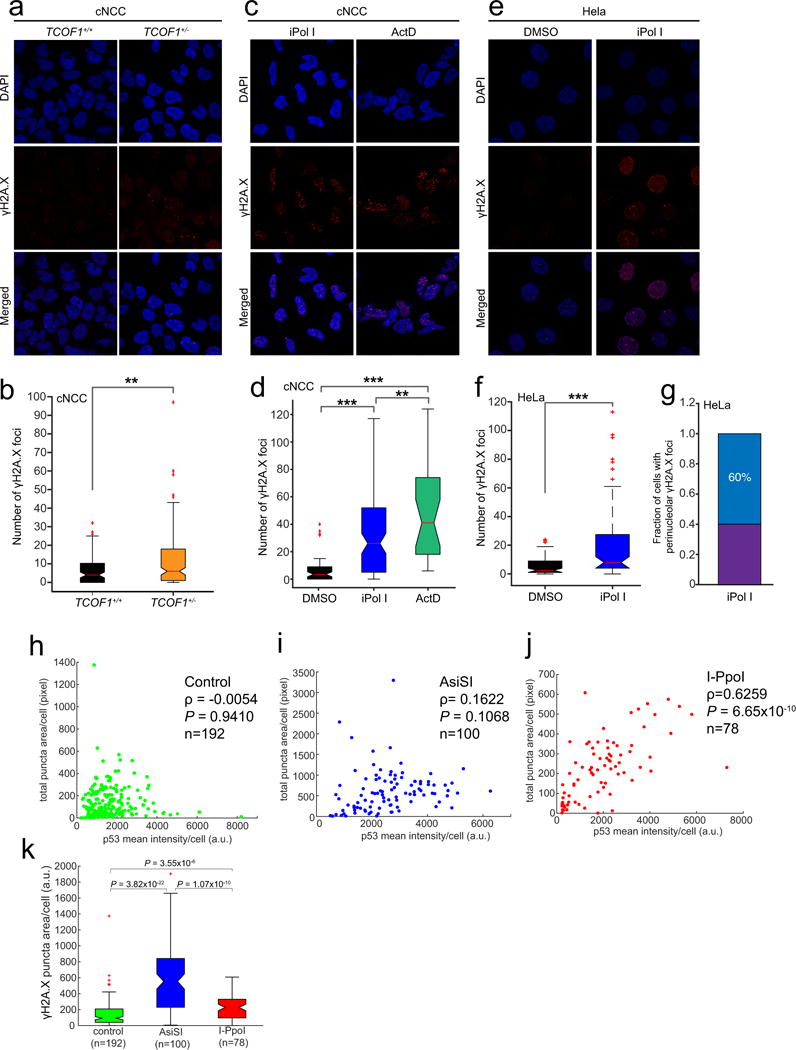
Extended Data Figure 8. Inhibition of Pol I results in DNA damage in a subset of cells.

a, Representative immunofluorescence images of wild-type and TCOF1+/− cNCCs stained with an antibody against γH2A.X; quantification is shown in b. c, Representative immunofluorescence images of DNA-damaged wild-type cNCCs stained with an antibody against γH2A.X after 1 h treatment with iPol I or actinomycin D (ActD); quantification is shown in d. e, Representative immunofluorescence images of DNA-damaged HeLa cells stained with an antibody against γH2A.X after 1 h treatment with iPol I; quantification is shown in f. For a–f, cells were collected from n = 3 biologically independent experiments. Boxes represent median value and 25th and 75th percentiles, whiskers are minimum to maximum, crosses are outliers. ***P < 0.001, two-sided Wilcoxon–Mann–Whitney test. g, Fraction of DNA-damaged HeLa cells displaying perinucleolar γH2A.X signal after 1 h incubation with iPol I. Cells were collected from n = 3 biologically independent experiments. h–j, Single-cell correlation plots of p53 activation and γH2A.X signal in control and cells expressing either AsiSI or I-PpoI. Cells were collected from n = 4 biologically independent experiments. ρ, Pearson correlation coefficient. P, two-sided Wilcoxon–Mann–Whitney test. k, Single-cell quantification of γH2A.X signal in control and cells expressing either AsiSI or I-PpoI. Cells were collected from n = 4 biologically independent experiments. Boxes represent median value and 25th and 75th percentiles, whiskers are minimum to maximum, crosses are outliers. P, two-sided Wilcoxon–Mann–Whitney test.
