Figure 6.

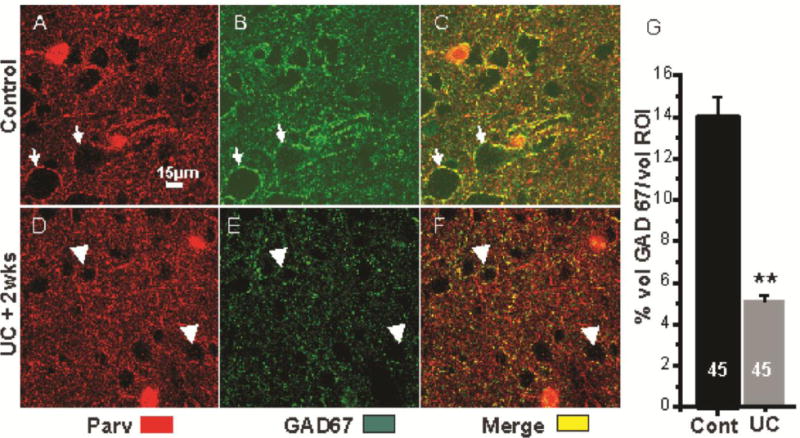
Reduced perisomatic GAD67-IR in UC. A–C: Immunoreactivity for PV (red), GAD67 (green) and PV+GAD67 (yellow) in 1 section through layer V of control cortex. Arrows: perisomatic halos around the same 2 Pyr cells in A–C. PV and GAD67 are colocalized in perisomatic terminals (yellow in C, merge). D–F: Comparable images to A–C in section from UC cortex 2 wks after lesion, processed with section of A–C. Arrows point to the same 2 cells in D–F. Perisomatic GAD67-IR is decreased (E vs. B, arrows). F: Merged D+E shows decreased GAD67 in PV-containing perisomatic halos (arrows). Somata of Pyr cells (voids) are smaller in UC sections (Prince and Tseng, 1993). Calibration in A for A–F. G: Percentage of GAD67-IR volume within the perisomatic ROI volume of layer V Pyr cells in control sections from 3 control and 3 UC rats, 15 cells/rat (see Methods).
