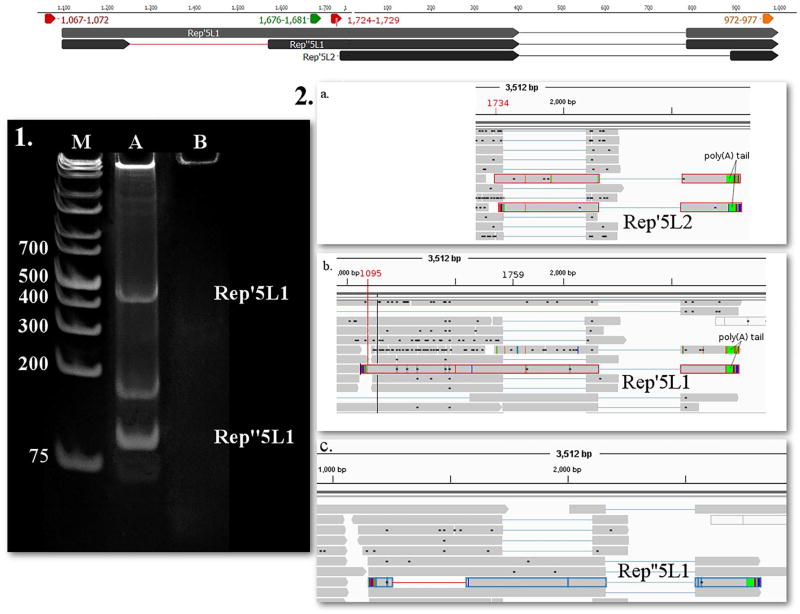
Fig. 4.
1. 12% acrylamide gel electrophoresis of Rep’5L1 and Rep”5L1, and 2. PacBio RSII IsoSeq reads of (b.) Rep’5L1 (c.) Rep”5L1 and (a.) Rep’5L2 yielded from the oligo(dT) primed reaction, and visualized with IGV. Lanes were loaded with cDNA products from RT-PCR and with GeneRuler 1 kb Plus DNA Ladder (lane M) (Thermo Fisher Scientific). Staining was performed with GelRed (Biotium). On lane A three bands appear, the upper one representing Rep’5L1 (product size 412 nts) while the lower one being Rep”5L1 (product size 83 nts). The middle band could be a splice variant not detected by our sequencing. Lane B was loaded with no-RT control. Yellow arrow-rectangle: TATA box; Red arrow-rectangle: Poly(A) signal, lines represent introns. (For interpretation of the references to colour in this figure legend, the reader is referred to the web version of this article.)

