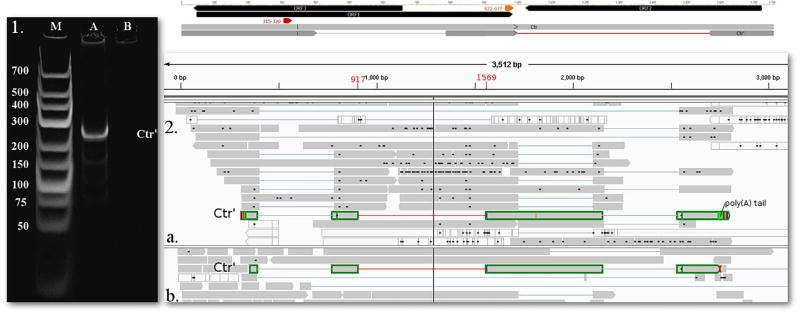
Fig. 6.
1. 12% acrylamide gel electrophoresis and 2. sequencing reads of the novel intron region in transcript Ctr. 1. The lanes were loaded with cDNA products from RT-PCR and with GeneRuler Low Range DNA Ladder (lane M) (Thermo Fisher Scientific). Staining was performed with GelRed (Biotium). On lane A one pronounced band appears using primers Ctr’fw and Ctr’r, with a product size of 259 nts. b. PacBio RSII IsoSeq oligo(d)T primed (a.) (read highlighted with green) and SMRT (b.) (read highlighted with green) reads, visualized with IGV. Yellow arrow-rectangle: TATA box, Red arrow-rectangle: Poly(A) signal, lines represent introns. The novel intron of the transcript is represented by a red line between 917 and 1569 nts. (For interpretation of the references to colour in this figure legend, the reader is referred to the web version of this article.)

