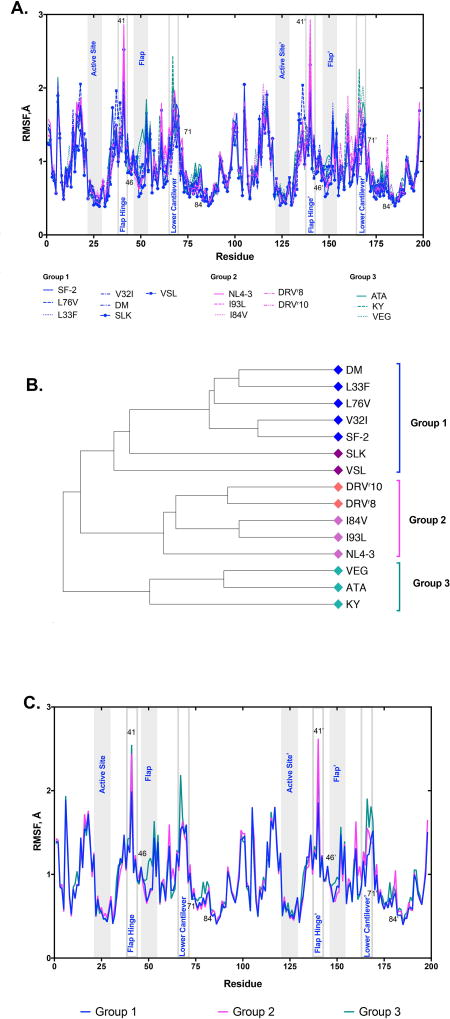
Figure 2. Protease dynamics may be indicative of resistance.
A. Per-residue RMSF values for all 15 protease variants plotted in three groups as defined by the clustering of the hierarchical dendrogram. B. Hierarchichal clustering dendrogram of per-residue RMSF values for all 15 variants. Colored annotations are similar to Figure 1C denoting similarity in per-residue RMSF among variants. C. Averages of variants as grouped in A. Group colors are the same as noted in A and B.

