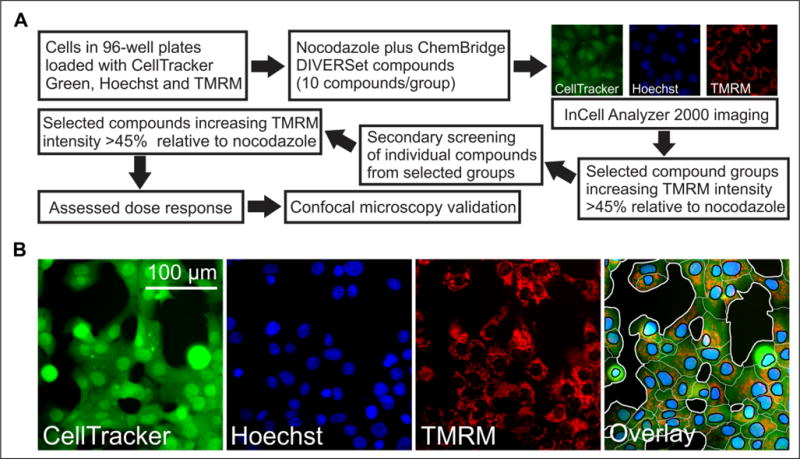
Figure 1.

Strategy to identify small molecules that prevent mitochondrial depolarization after NCZ using high-content imaging. An IN Cell Analyzer 2000 was used to identify lead compounds that revert NCZ-induced mitochondrial depolarization. (A) The first screen was performed using mixtures of 10 library compounds. Mixtures increasing TMRM fluorescence in the presence of NCZ by ≥45% relative to cells treated with NCZ alone were considered positive. Compounds from positive mixtures were then assessed individually in a secondary screening. The top individual compounds were assessed for dose–response, and the most active compounds were selected and validated by confocal microscopy. (B) Representative images for each channel and the overlay are shown. A representative segmentation (far right panel) demonstrates how cells were segmented based on the fluorescent channels. Black areas are extracellular space, and white lines define cellular boundaries. Black lines segment blue nuclei from green cytoplasmic spaces. TMRM fluorescence for each cell was calculated by multiplying the mean cytoplasmic TMRM fluorescence (background subtracted) by the cytoplasmic area.
