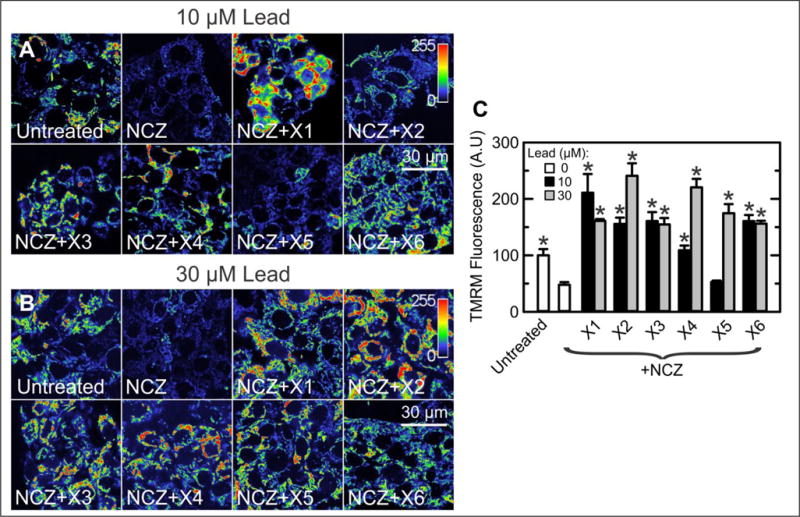
Figure 4.

Lead validation by confocal microscopy in HepG2 human hepatoma cells. (A) HepG2 cells were untreated or treated with NCZ (10 μM) or NCZ (10 μM) plus lead compounds (10 μM), and confocal imaging was performed after 60 min. The indicator bar is a pseudo–color scale of the intensity of TMRM fluorescence. Note that X1–X4 and X6 reverted mitochondrial depolarization caused by NCZ (see also C). (B) Conditions are the same as in A except that the lead compound concentration was 30 μM. Note that all compounds reverted NCZ-induced mitochondrial depolarization and actually hyperpolarized mitochondria relative to untreated cells. (C) TMRM fluorescence under conditions of A and B is plotted. *p < 0.05 compared with NCZ alone (n = 3).
