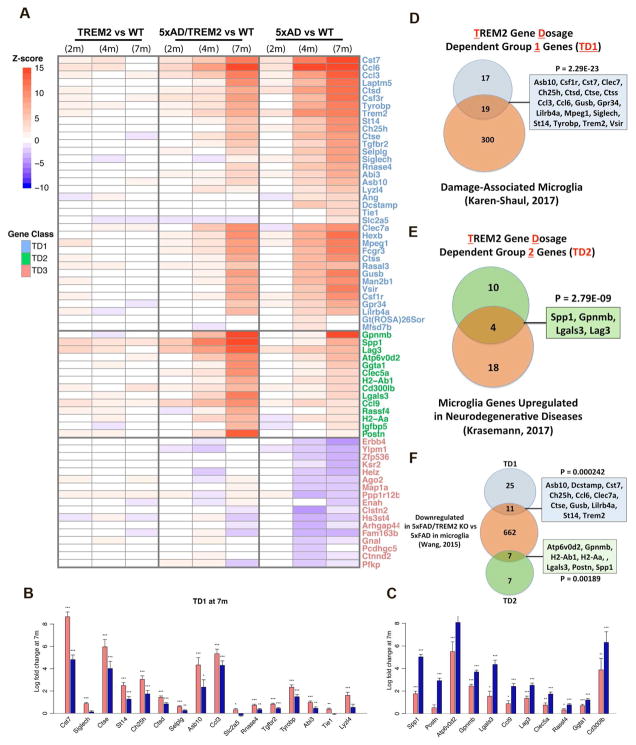
Figure 4. Increased TREM2 gene dosage reprogrammed disease-associated microglia gene expression.
(A) Heatmap representation of differential expression Z statistics for TD1-3 genes. Genes are divided into TD1 (blue), TD2 (green) and TD3 (red).
(B–C) Fold changes of individual TD1 (B) and TD2 (C) genes in 5xFAD (red) and 5xFAD/TREM2 (blue) vs. wildtype mice at 7m. Stars indicate FDR-corrected significance (***FDR<0.001, **FDR<0.01, *FDR<0.1). n=6 per genotype, except n=5 for 5xFAD.
(D–F) Venn diagrams of overlaps of TD1 (blue) and TD2 (green) genes with published genesets (orange).

