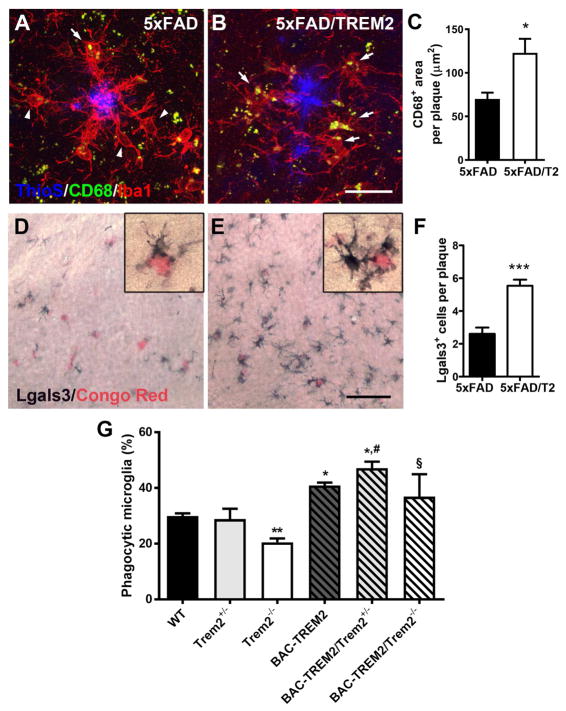
Figure 6. Increased TREM2 gene dosage upregulated expression of phagocytic markers and enhanced phagocytic activity in microglia.
(A–C) Matching cortical sections from 7 month-old 5xFAD (A) and 5xFAD/BAC-TREM2 mice (B) were stained with CD68 (green), Iba1 (red) and ThioS (blue). (C) Area of CD68+ labeling per plaque was measured on z-stack confocal images. n = 4 per genotypes, *p < 0.05. Bar = 25μm.
(D–F) Matching cortical sections from 7 month-old 5xFAD (D) and 5xFAD/BAC-TREM2 mice (E) stained with Lgals3 (dark blue) and Congo Red (pink). (F) Number of Lgal3+ cells per plaque were counted under microscope by a blinded observer. n = 3 per genotypes, ***p < 0.001. Bar = 50μm.
(G) Phagocytosis of Alexa488-conjugated microsphere by primary microglia were measured by flow cytometry. Phagocytic microglia were detected with strong fluorescent signal in the cells. The graph is pooled results from 4 independent experiments and presented as mean ± SEM. n = 3–6 per genotypes; **p < 0.01, *p < 0.05 compared to WT; #p < 0.05 compared to Trem2+/−; §p < 0.05 compared to Trem2−/−.

