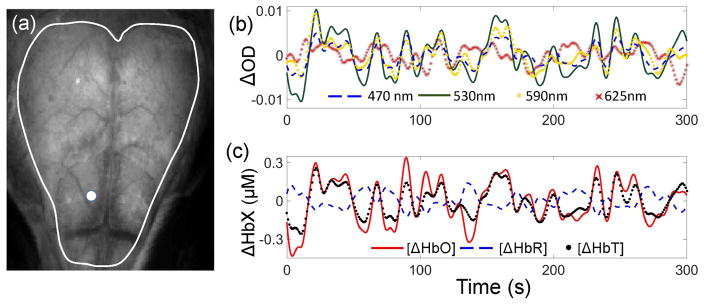
Figure 2.
(a) The exposed mouse skull image obtained under LED illumination. White line outlines a region of interest selected for computing the connectivity maps. (b) Typical time courses of the optical density changes measured at 470 nm, 530 nm, 590 nm, and 625 nm. ΔOD at 590 nm and 625 nm were multiplied by 3 and 4, respectively, to appear on the same scale as the rest of the signals. (c) Time courses of the Δ[HbO], Δ[HbR], and Δ[HbT]. White dot in panel (a) marks the measurement location of the signals plotted in panels (b) and (c).

