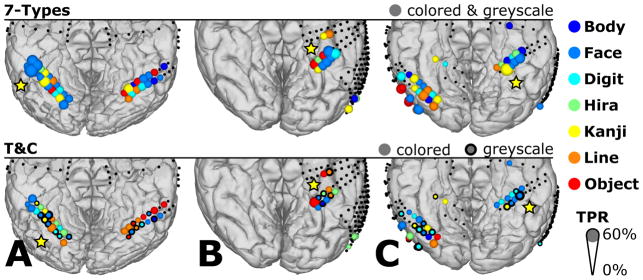
Figure 10.
Spatial distribution of the classes with the highest TPR for types without color separation (7-Types) and types with color separation (T&C) for subjects A, B and C. Diameters show the TPR and the colors indicate the types with the highest TPR. Only channels with significant activation in the channel selection test were considered for classification (locations with colored dots). All other recording locations were excluded from experiment I and are indicated with small black dots. Yellow stars highlight sites with the highest TPR.

