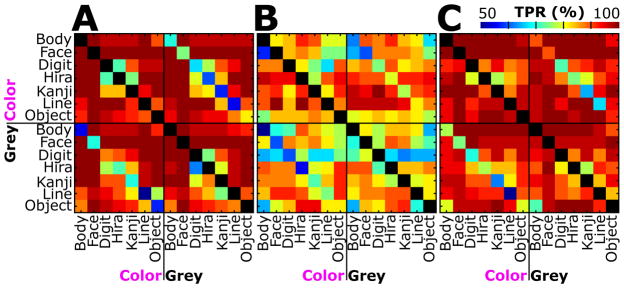
Figure 6.
Results for pair-wise classification of colored (Color) and greyscale (Grey) stimulus types for subjects A, B and C. Colored squares indicate the true positive rate (TPR) for each type (rows) and color (columns) against every other type and color. A blue box indicates random classification, while perfect classification is highlighted in red (see color bar; 50% chance for paired classification). Diagonals are shown in black (i.e., no TPR available), as the same class templates used for discrimination were the same. The diagonals in the bottom left and top right quarter of each subject contain the TPR of colored stimuli against greyscale stimuli of the same type.

