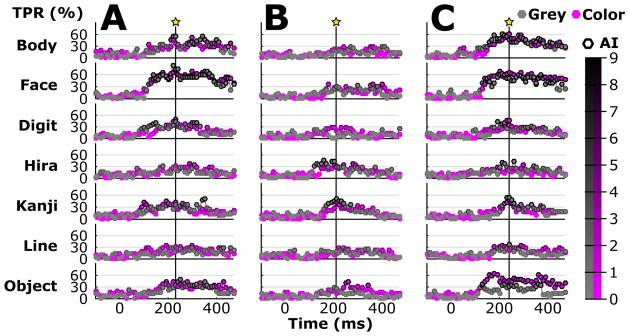
Figure 8.
TPR and activation index (AI) over time for types and colors. Each time segment (20 ms epochs with 50% overlap) led to a feature vector and resulted in an independent classification output. Thus, the curve represents the TPR for individual segments and the edge color of each bullet shows the AI (black edges indicate reliable activation), which was derived from a randomization test with scrambled trial labels. Stars with vertical lines represent the times for which average TPR and AI maximized for types and colors.

