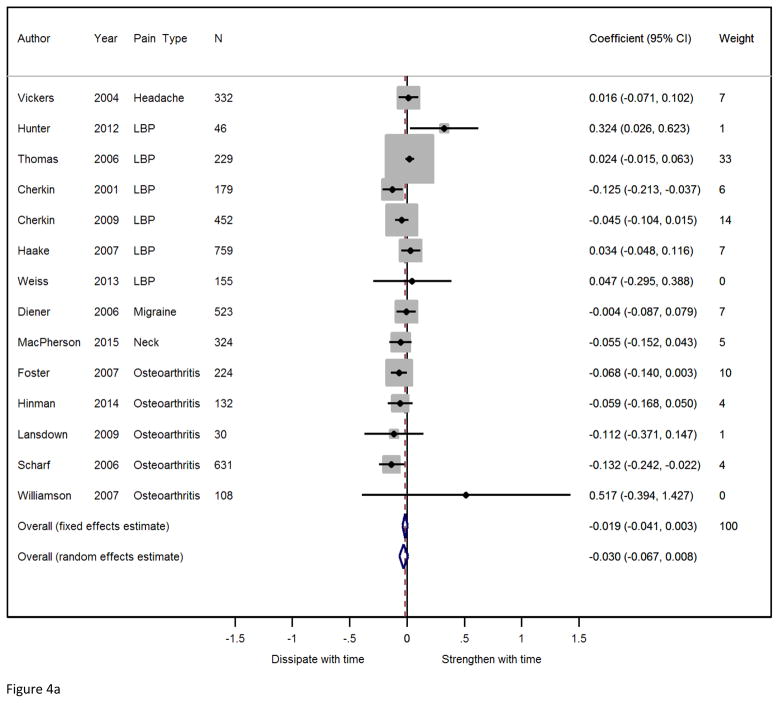
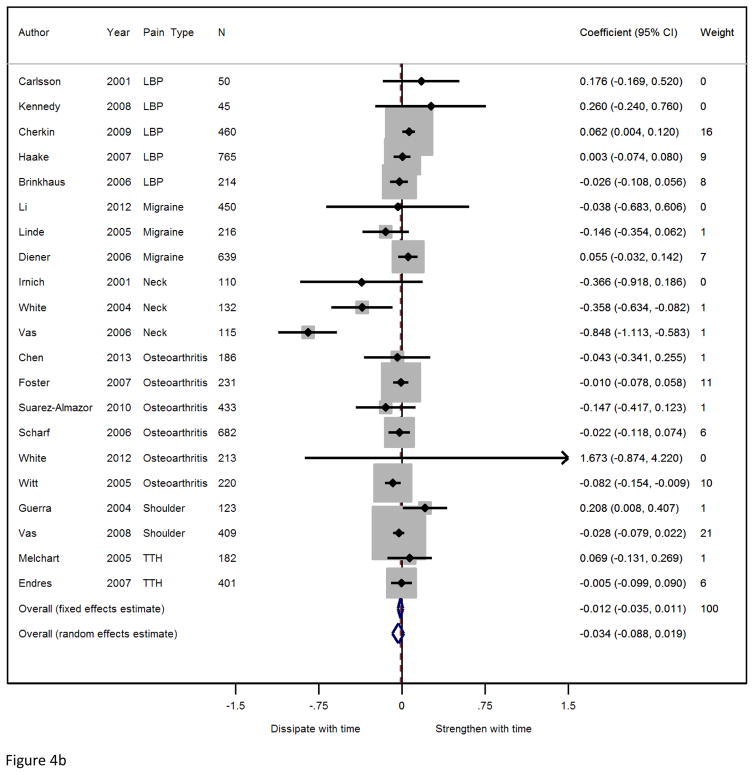
Figure 4.
Forest plot showing the difference in pain change scores between acupuncture and no acupuncture control groups (a) and between acupuncture and sham acupuncture groups (b) over time. A coefficient of 0.01 means that the difference between acupuncture and control increases by 0.01 standard deviations for each 3 months following the end of treatment.


