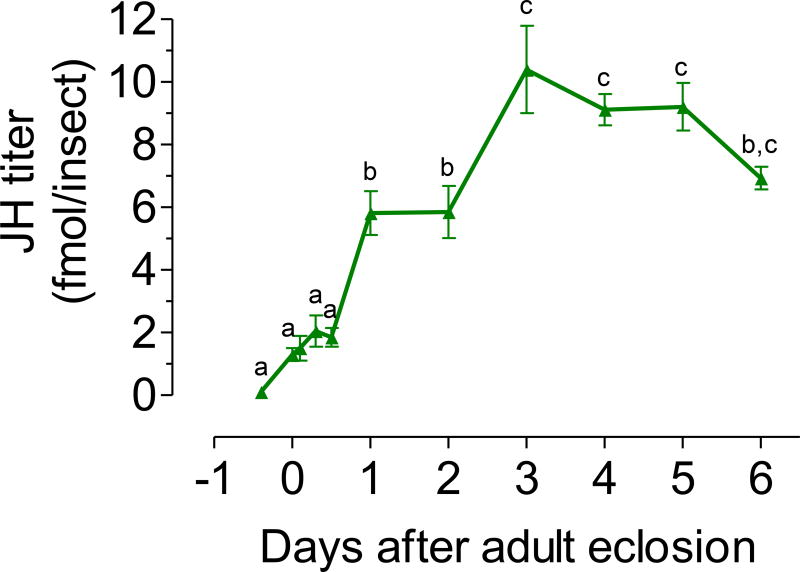
Fig. 3. JH hemolymph titers.
JH hemolymph titers in virgin males fed a 3% sugar meal. X axis: represent days before (pupa) and after adult eclosion. JH titers are expressed as fmol/insect. Each data point represents the mean ± SEM of 4 to 20 independent replicates of groups of 5 males. Different letters above the points indicate significant differences among treatments (one way ANOVA p < 0.05, with Tukey’s test of multiple comparisons).

