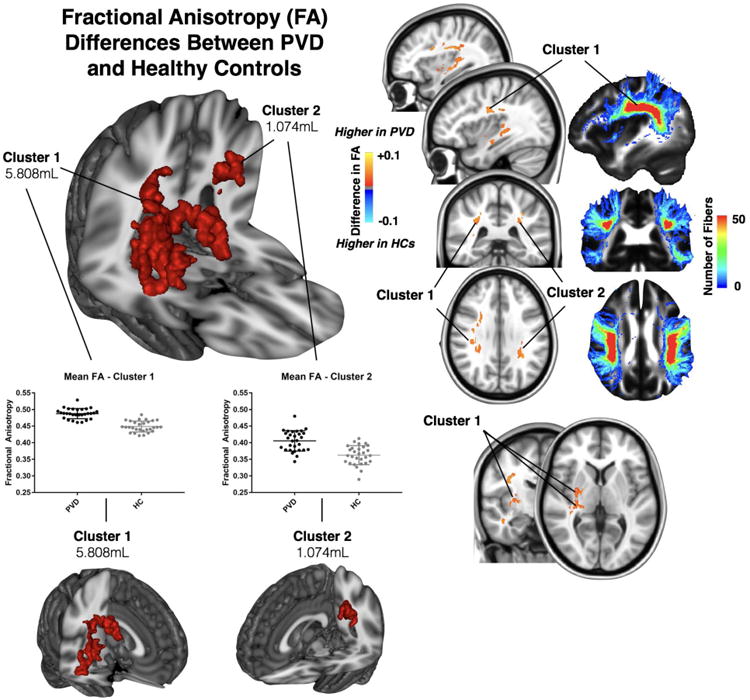
Figure 1. Fractional Anisotropy (FA) Differences Between PVD and Healthy Controls.

Significant clusters, 1 and 2, showing FA differences between PVD and HC groups. Left, three-dimensional rendering of largest significantly different clusters of FA differences, showing elevated FA values in the PVD group compared to the HC group, with column scatter plots of the mean FA values for the PVD and HCs for each cluster. Right, two-dimensional images of significantly different clusters, sagittal and coronal multi-section images displayed next to probabilistic tractography rendering of the superior longitudinal fasciculus.
