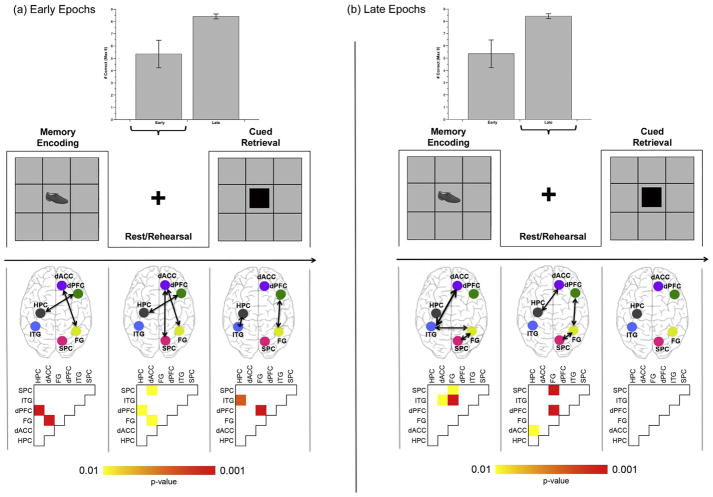
Fig. 6.
Performance and uFC profiles are depicted during each of the (a) Early and (b) Late periods of the task. The bar graphs in each panel depict averaged performance across Early and Late epochs (see Fig. 1b for performance curve; error bars are ± sem). Following the depiction of the conditions of the paradigm, schematic brain images depict pathways, the uFC of which was significantly modulated under condition. The probability matrices below correspond to the brain images. As seen, the characteristics of uFC modulation during Rest/Rehearsal appear to be dynamic (as a function of task period). During early learning periods uFC of dACC ↔ SPC, dACC ↔ FG and dPFC ↔ Hippocampus is significantly modulated during Rest/Rehearsal. Later, these patterns of modulation shift to the dACC ↔ Hippocampus, dPFC ↔ FG and SPC ↔ FG pathways.

