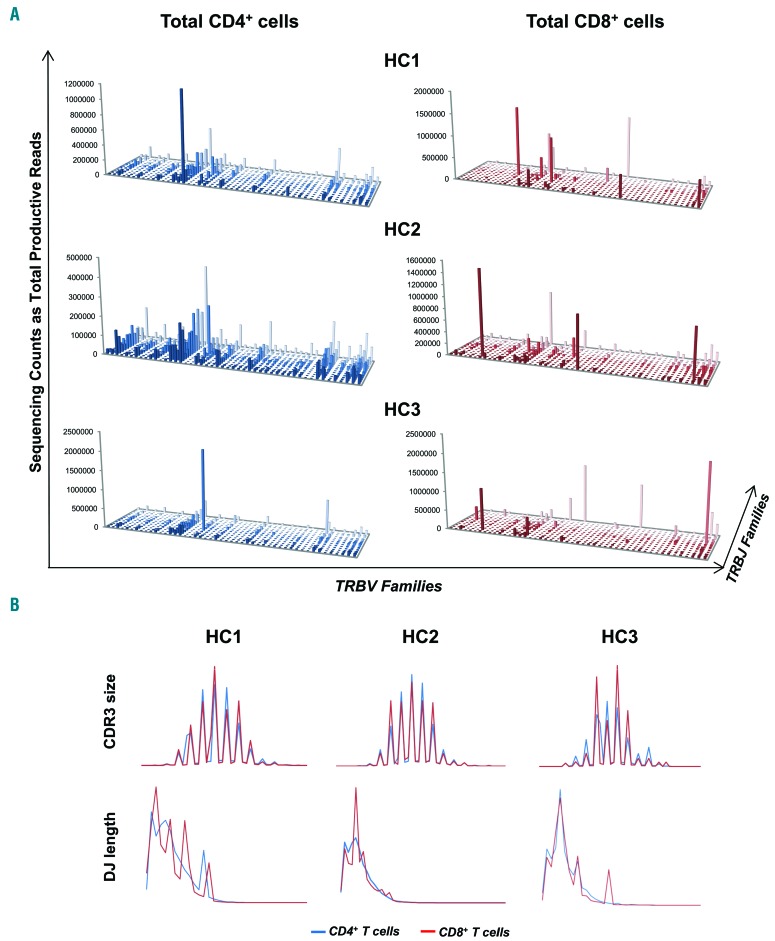
Figure 3.
Characterization of Vβ/Jβ plot, CDR3 size and DJ length profiles in healthy donors by deep sequencing. (A) T-cell receptor β variable (TRBV)/T-cell receptor β joining (TRBJ) plots showed a “citylike” landscape for total CD4+ and CD8+ cell populations in healthy subjects (HC). (B) The size of the complementarity region 3 (CDR3) and DJ length profiles were also defined, showing similar features in CD4+ and CD8+ cells.

