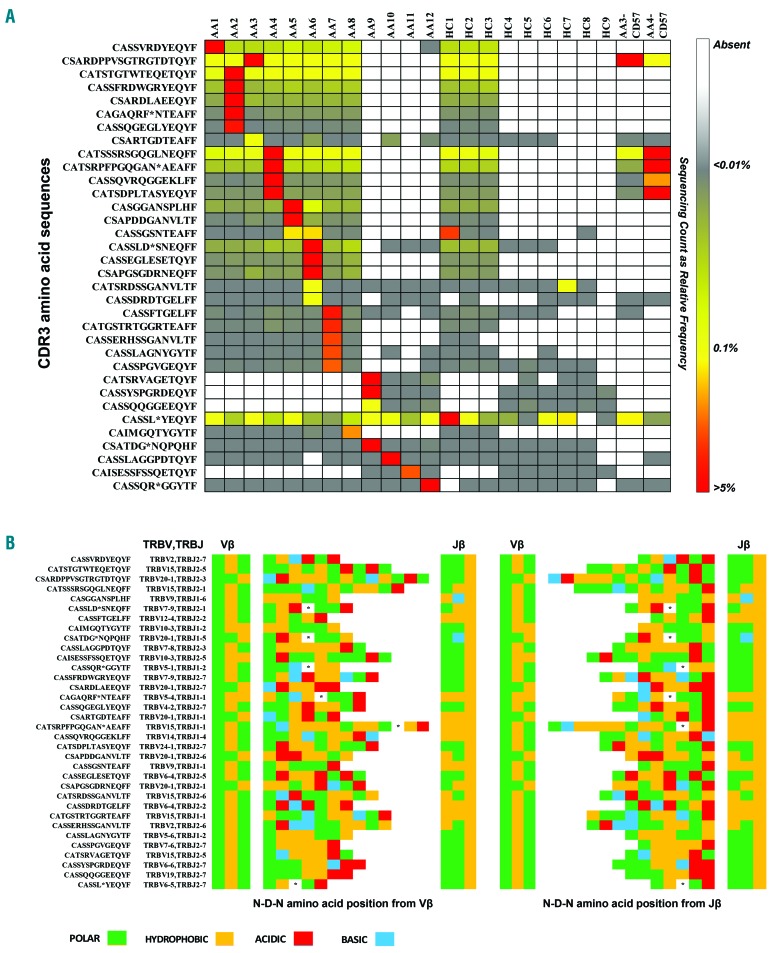
Figure 6.
Homology assessment. (A) CDR3 sequence pools were analyzed among patients (AA) and healthy subjects (HC) for the presence of homology. Shared and immunodominant sequences were reported as a heatmap based on their relative expression: in the same row, from lowest (gray; <0.01%) to highest (red; >5%) values. (B) Structural analysis was performed comparing the sequences for common pattern, using both alignments at the N-terminal of Vβ gene (left) or at the C-terminal of Jβ gene (right).

