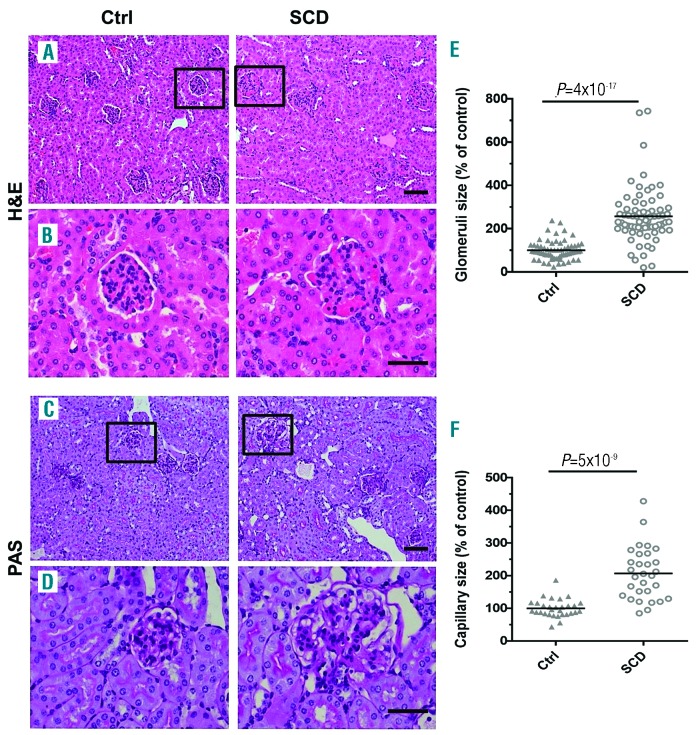
Figure 1.
Renal disease in sickle cell disease (SCD) mice is characterized by significant glomeruli hypertrophy and capillary dilation. (A-D) Representative pictures of hematoxylin and eosin staining (H&E) (A and B), and periodic acid–Schiff staining (PAS) (C and D) of renal sections. Squares show enlarged areas (B and D). Bar sizes on microphotographs are 100 μm (A and C) and 40 μm. (B and D). (E and F) Quantification of glomeruli size (E) and capillary size per glomeruli cross section (F) is performed using CellSens Standard software. Five mice per group were used for each staining. For quantification graphs, means are shown. Each dot represents a value obtained from one glomerulus cross-section. Ctrl: control.

