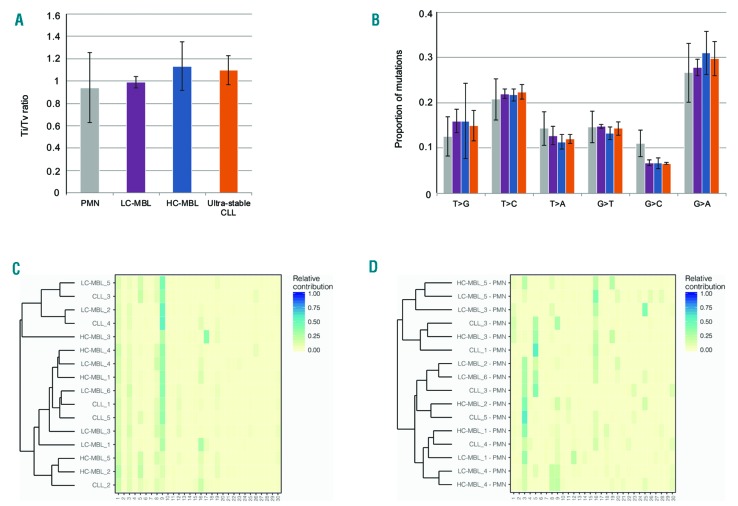
Figure 2.
Detailed analysis of mutation types. (A) Transition to transversion (Ti/Tv) ratios were comparable in all monoclonal B-cell lymphocytosis (MBL)/chronic lymphocytic leukemia (CLL) samples and somewhat lower in the polymorphonuclear (PMN) cell samples. (B) Similar distribution of mutations among the 6 mutation classes for each MBL/CLL entity and PMN samples (average values ± Standard Deviation). Similar profiles were evident for all entities with the G>A mutation pre- dominating in all cases. (C) Mutational signatures that contribute to the somatic mutations observed in the MBL/CLL samples. (D) Mutational signatures that dominate in the PMN samples.

