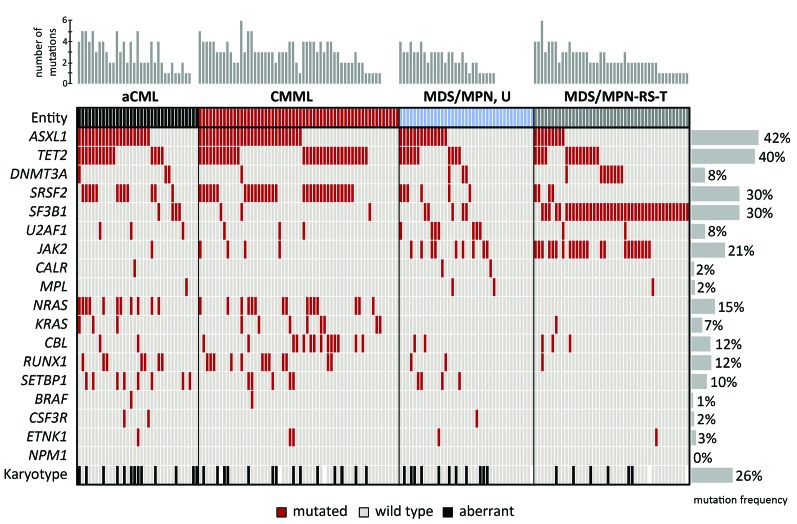
Figure 1.
Molecular and cytogenetic characterization of patients with myelodysplastic/myeloproliferative neoplasms. Illustration of all 177 samples: each column represents one patient. All 18 analyzed genes as well as karyotype information are given for each patient. Light gray: wild type or normal karyotype, red: mutated, black: aberrant karyotype, white: no data available. The number of mutations per patient is illustrated as a bar chart above the graph, the mutation frequencies of single genes are given as a bar chart at the right.

