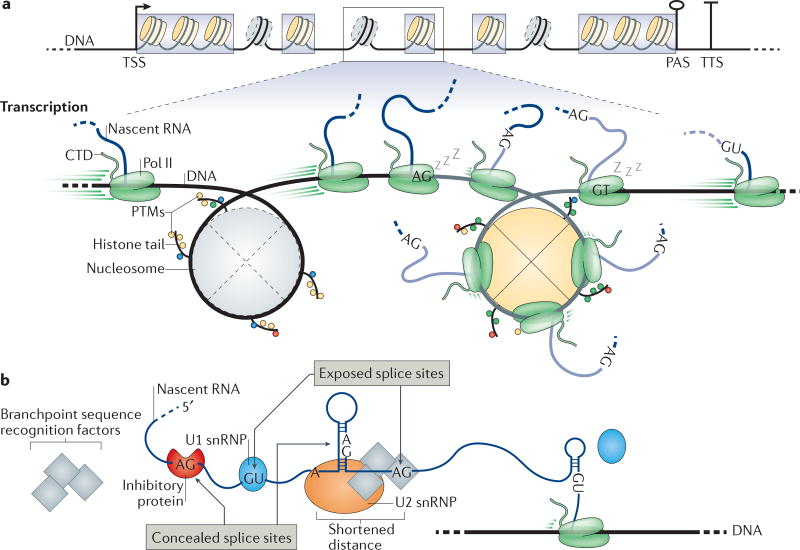
Figure 4. Gene architecture, chromatin features and nascent RNA properties influence co-transcriptional splicing.
a | The length of typical internal exons (grey boxes) is comparable to the DNA that is wrapped around a nucleosome. Nucleosome positioning relative to the transcription start site (TSS), transcription termination site (TTS) and, to a lesser extent, exons helps to define the boundaries of these elements, providing a platform for crosstalk between chromatin, transcription and splicing. Less stable nucleosomes at introns are indicated with dashed outlines. For simplicity, only one TSS, poly(A) site (PAS) and TTS are depicted. The zoomed-in section shows that RNA polymerase II (Pol II) transcription rates change along introns (black lines with grey nucleosomes) and exons (grey lines with yellow nucleosomes) from high rates to low rates. A sleeping Pol II represents pausing events at splice sites (AG and GT). Post-translational modifications (PTMs) on histone tails influence transcription and splicing. b | RNA secondary structures and RNA-binding proteins can modulate the availability of splice sites and branchpoint sequences. The splicing machinery cannot identify sites that are concealed in secondary structures or that are bound by inhibitory proteins. Pol II transcription rate and local RNA folding contribute to site accessibility. CTD, carboxy-terminal domain; snRNP, small nuclear ribonucleoprotein.

