Figure 2.
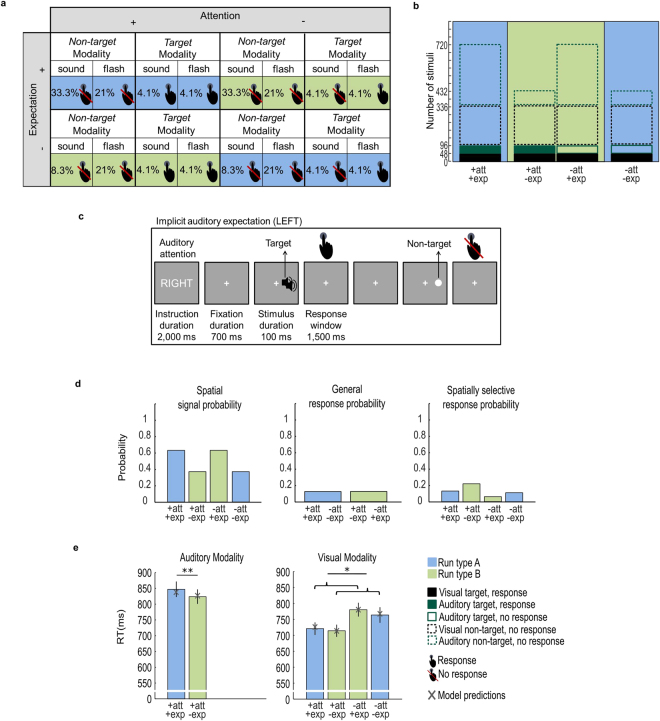
Experiment 2: Design, example trial, probabilities, observed and predicted response times. (a) Auditory spatial attention and expectation (i.e. signal probability) were manipulated in a 2 (attended vs. unattended) x 2 (expected vs. unexpected) x 2 (auditory vs. visual) x 2 (target vs. non-target) factorial design. Colours indicate run type (blue: attention and expectation are congruent; green: attention and expectation are incongruent). Presence vs. absence of response requirement is indicated by the hand symbol. (b) Number of auditory (dark green) and visual (black) trials in the 2 (attended vs. unattended) x 2 (expected vs. unexpected) conditions. The bar plots are filled (i.e. response required) or not filled (i.e. no response required). Their contours indicate target vs. non-target trials (solid = target; dotted = non-target). The fraction of filled area for each bar represents the spatially selective response probability, which is greater in the unexpected than expected conditions. (c) At the beginning of each run, a cue informed participants whether to attend and respond to auditory targets (i.e. double noise burst) selectively in their left or right hemifield throughout the entire run. On each trial participants were presented with an auditory or visual stimulus (100 ms duration) either in their left or right hemifield. They were instructed to respond to auditory targets (i.e. double noise burst) only in the ‘attended’ hemifield and to all visual targets (i.e. double flash) irrespective of hemifield as fast and accurately as possible with the same finger. The visual or auditory non-targets never required any response. The response window was limited to 1500 ms. Participants were not explicitly informed that auditory signals were more likely to appear in one of the two hemifields. Instead, spatial expectation (i.e. spatial signal probability) was implicitly learnt over runs. (d) The bar plots show i. spatial signal probability: the probability that a signal (pooled over visual and auditory modalities) was presented in a particular hemifield, ii. general response probability: the probability that a signal required a response in a particular (green or blue) run type, iii. spatially selective response probability: the probability that a signal required a response conditioned on that it was presented in a particular hemifield. (e) The bar plot shows across subjects’ mean (±SEM) response times for each of the six conditions with response requirements. The brackets and stars indicate significance of main effects and interactions. *p < 0.05; **p < 0.01. The grey crosses show the condition-specific response times predicted by the ‘winning’ ModelLog 2 that includes attention, general response probability and spatially selective response probability as predictors.

