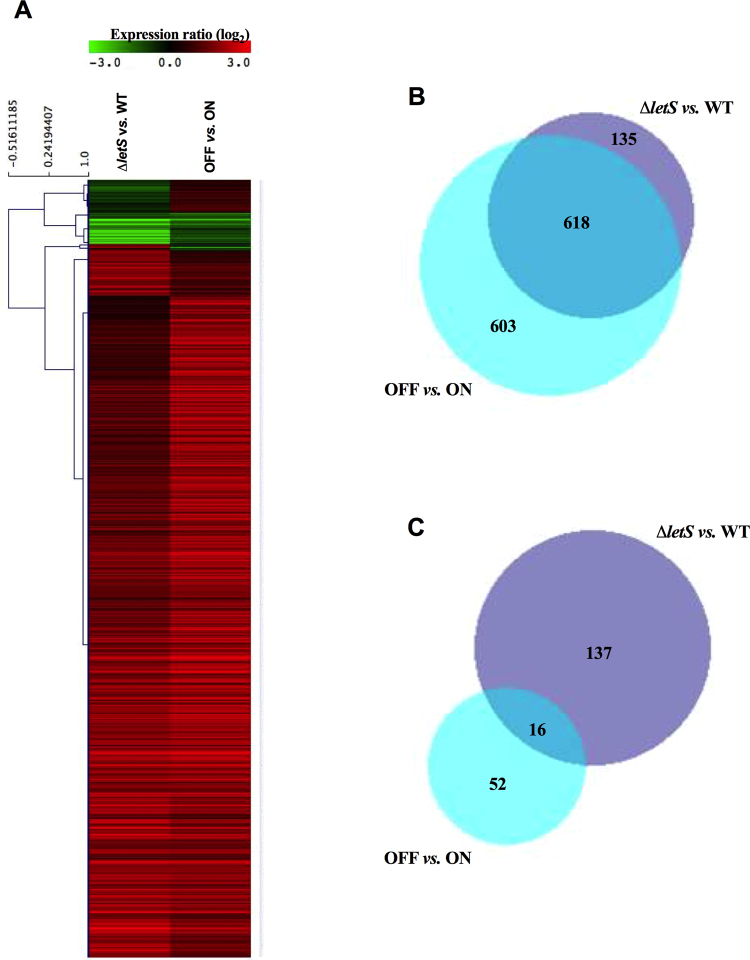
Figure 4.
The absence of letS leads to ectopic up-regulation of gene expression in water. (A) A heat map showing genes differentially expressed in ∆letS compared to the WT (left), and in OFF compared to ON (right) (ratio to control value of ± 2-fold with a p < 0.05). Genes that are up-regulated in ∆letS and OFF are shown in red; genes that are down-regulated are shown in green. The number of up- (B) or down-regulated (C) genes that are shared between the ∆letS vs. WT and OFF vs. ON groups are shown in Venn diagrams.

