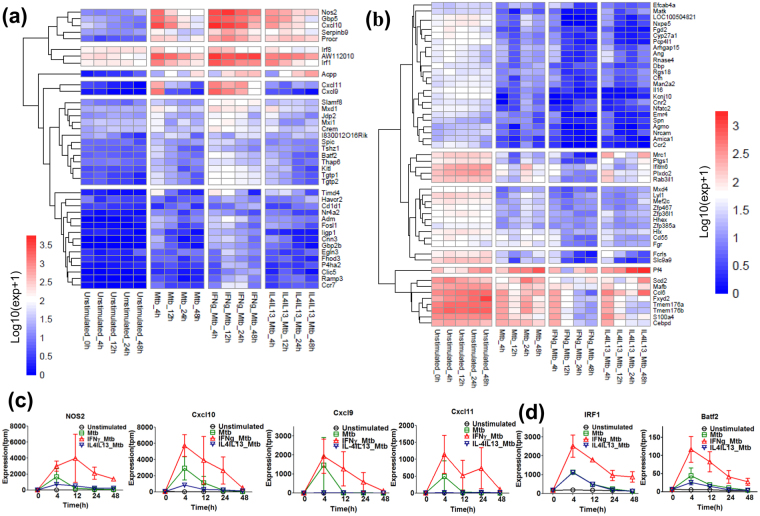
Figure 4.
Mtb infection augments M1 gene activation in M1 pre-activated macrophages. Using the differential expressed genes, qualitative analysis was performed in Mtb, IFNγ_Mtb, IL-4/IL-13_Mtb samples. Several fold elevated or suppressed genes were identified by calculating TMP expression fold change of IFNγ_Mtb in comparison with Mtb, IL-4/IL-13_Mtb samples at each time point. IFNγ pre-stimulation-mediated several fold up regulated (a) and suppressed or down regulated (b) non TF genes (10-fold respectively) and TF genes (3-fold respectively) was selected as seen in the heatmap cluster in each time point. Both heatmaps shows un-stimulated control which indicate the basal level of gene expression. (c) Expression profiles of representative M1 key effector genes, Nos2, Cxcl10, Cxcl9 and Cxcl11. (d) Expression profiles of representative M1 key TF genes, Batf2 and Irf1.

