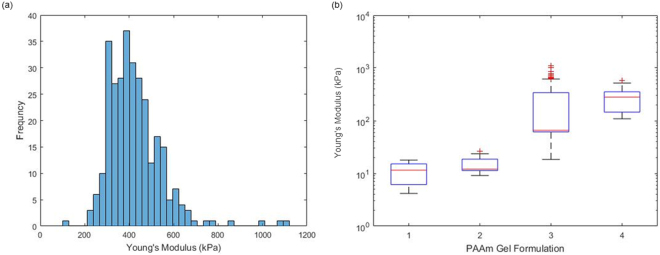
Figure 6.
(a) Wet AFM data obtained on PAAm sample formulation 3 showing a histogram of the spread of moduli values for 3 repeats of 100 indentations on a 5 × 5 μm sampling area and (b) box and whisker plot showing the overall spread across the range of PAAm samples tested. All AFM experiments were conducted with an indentation depth of between 500 and 1000 nm and each curve was done over 1 s, 900 repeats per formulation were conducted with three samples per formulation.

