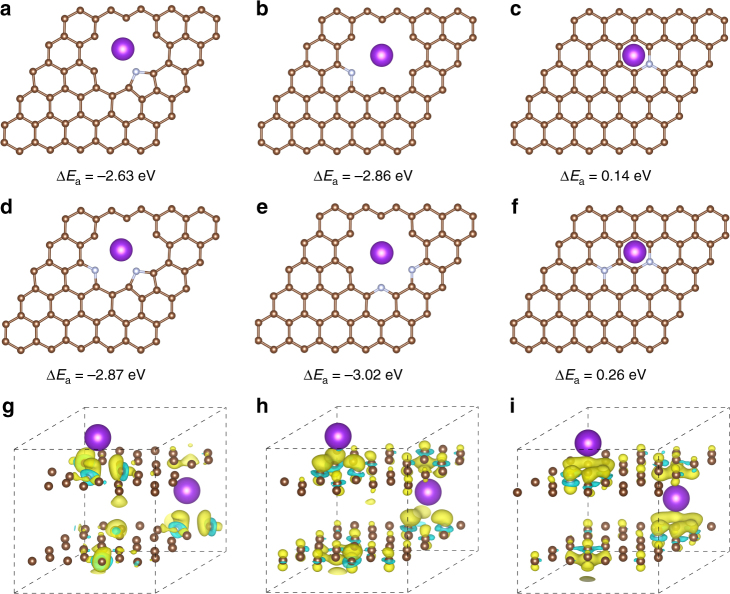
Fig. 6.
Theoretical simulations of K-adsorption in different N-doped structures. Top view of a single K atom adsorbed in the N-5 (a), N-6 (b), and N-Q (c) structures and the corresponding adsorption energy. Top view of a single K atom adsorbed in the doped structures with two nitrogen atoms and the corresponding adsorption energy: d one N-5 and one N-6 atoms; e two N-6 atoms; f two N-Q atoms. Electron density differences of K absorbed in the N-5 (g), N-6 (h), and N-Q (i) structures. Yellow and blue areas represent increased and decreased electron density, respectively. The isosurfaces are the 0.0015 electron bohr3 . Brown, silver, and purple balls represent carbon, nitrogen, and potassium atoms, respectively

