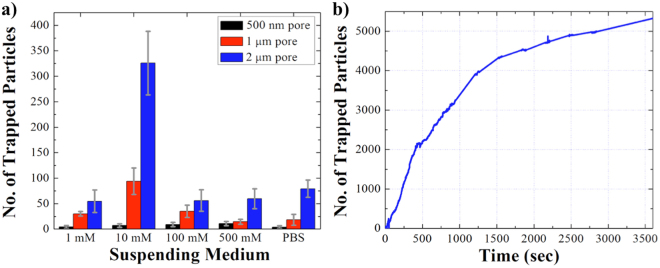
Figure 6.
(a) The correlation between the number of trapped particles, the ionic strength of the solution, and the pipettes’ diameter. Each experiment was conducted under 10 V/cm with positive bias applied at the base of the pipette and the data was collected after 100 seconds of applied voltage. (b) The correlation between the number of trapped particles and the run time. The COOH-PS beads were suspended in 10 mM KCl pH 7.0, and 10 V/cm was applied at the base of the 2 μm pipette.

