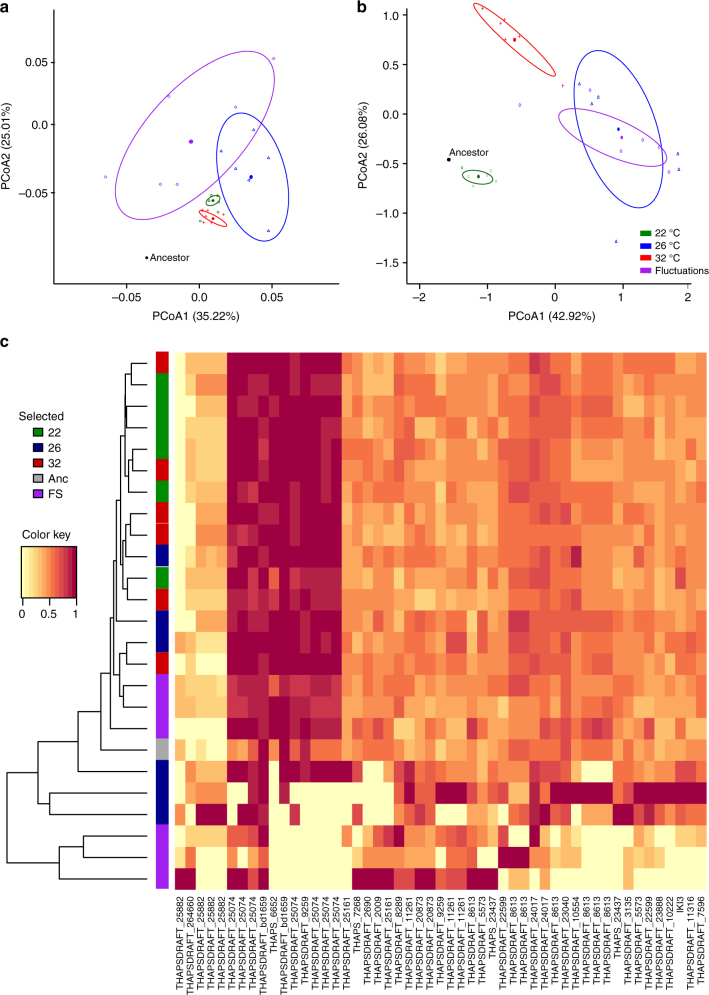
Fig. 4.
Molecular and phenotypic evolution in T. pseudonana. a Principal component analysis (PCA) of evolved and ancestral lineages calculated from distance matrices based on single-nucleotide variants (SNVs) in protein-coding regions that had reached fixation after 300 generations of evolution. b PCA of phenotypic traits calculated from the change in each trait measured at the treatment temperature relative to that expressed in the ancestor at the same temperature. In panels a, b colors indicate the selection regime with black for the ancestor, green for 22 °C, blue for 26 °C, red for 32 °C, and purple for the fluctuating regime. The ellipses in PCAs give the 95% confidence interval around the centroid and thus give an idea of whether the treatments differ significantly (detailed information on the statistical significance of separation of the selection environments can be found in Table 1 & Supplementary Tables 12 and 13). c Estimated allele frequencies for 1703 single-nucleotide variants that putatively reached fixation in at least one t300 population. Of these, 1689 are missense, and 14, stop-codon variants. The color of each cell in the heat-map indicates the estimated allele proportion in the population, based on the ratio of variant sequence reads versus total read depth at that genomic site. Homozygously fixed alleles will appear as yellow or red (allele proportion zero or one, respectively), heterozygously fixed alleles as orange. The side-bar indicates the selection regime with colors as stated above

