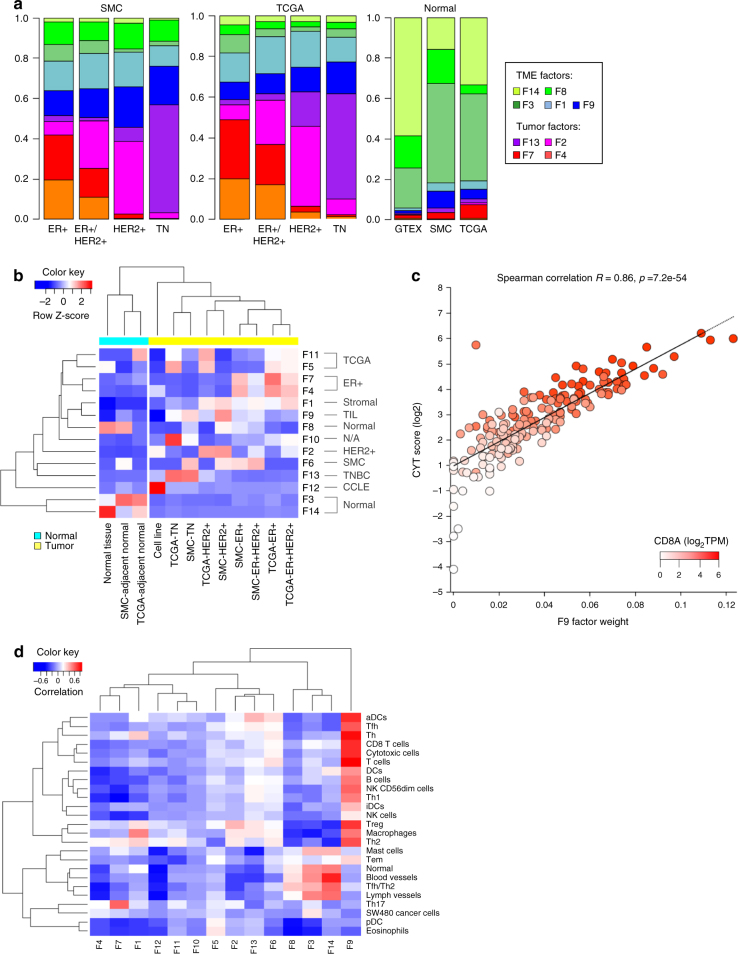
Fig. 4.
Tumor virtual microdissection identified distinct tumor intrinsic and microenvironment factors. a Distribution of NMF factors representing TME or tumor intrinsic compartment across subtypes of SMC and TCGA. b Heatmap showing the mean sample factor weight for 14 NMF factors, z-normalized by rows, in different cohorts. Samples of normal tissue origins were clustered to the left and samples of tumor origins were clustered to the right. c Plot of CYT score vs. F9 factor weight with color gradient representing CD8A gene expression. d Heatmap of Pearson correlation coefficients between Bindea immune expression signature scores (GSVA) and NMF factors

