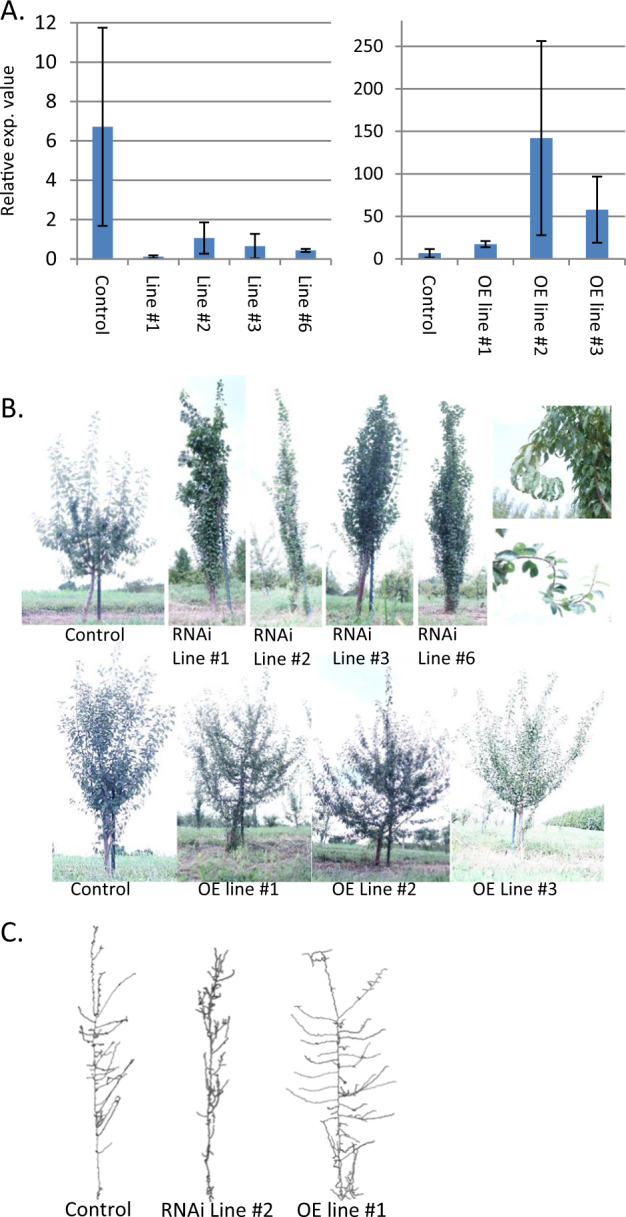
Fig. 3. Transgenic plums with altered TAC1 expression display branch angle phenotypes.

a qPCR results showing relative TAC1 expression in RNAi and overexpression (OE) lines. Bars represent standard deviations of biological replicates. b Images of 3-year field-grown RNAi (top) and OE (bottom) lines. Images on right show the occasional twisting branch phenotype observed in pillar peach (upper) and RNAi plum (lower). The control of the RNAi lines is the cultivar President and the cone for the OE lines is Bluebyrd. c Skeletonized representations of trees created from 3D reconstructions taken after year 2 in the field
