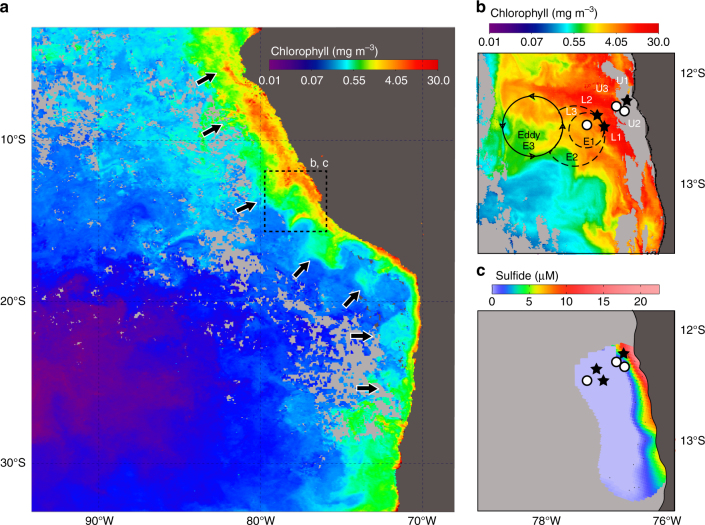
Fig. 1.
Station and mesoscale eddy location relative to near-surface chlorophyll a and maximum dissolved sulfide concentrations. a Monthly composite MODIS image (see Methods for source) showing near-surface chlorophyll concentrations for March 2013, where the arrows indicate cross-shelf advected filaments. b MODIS image of near-surface chlorophyll concentrations for 24 February 2013. The main water column sampling stations (U1, L1, and L2) are marked with black stars; additional stations with white circles. Times of station sampling are provided in Supplementary Table 1. Formation and propagation of the eddy westward occurring over time is indicated: E1 represents the initial eddy formation from 28 January to 3 February; E2 shows the expansion of the eddy (7–12 February 2013); and E3 is the location of the eddy when the image was taken (24 February 2013). c Maximum sulfide concentration reported for water masses with densities between 26.1 and 26.2 kg m−3

