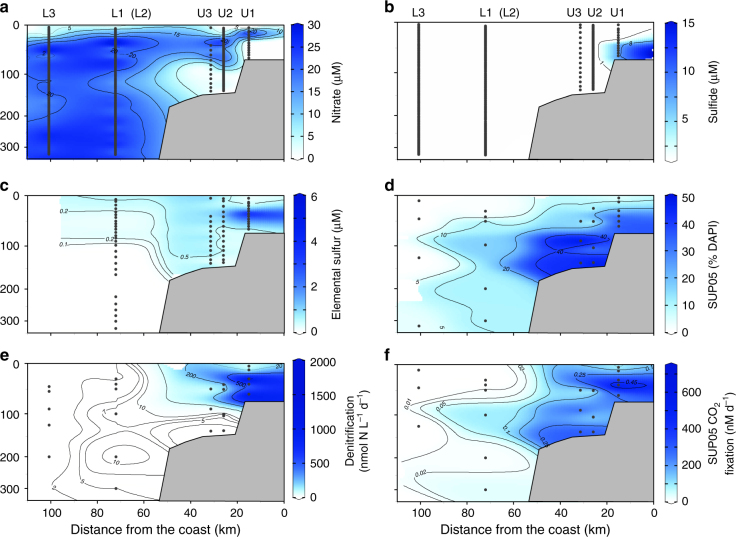
Fig. 2.
Distribution of concentrations, abundances, and bulk and single-cell activities in the Peru Upwelling OMZ as a function of distance from the coast. The composite plots show depth and cross-shelf distribution a nitrate, b dissolved sulfide, c elemental sulfur, d % total bacteria (DAPI) identified as SUP05, e bulk rates of denitrification, and f single-cell determined rates of CO2 fixed by SUP05 at the time of eddy-induced offshore transport of shelf waters. Note that station L2 (not included in composite) was located near station L1, but occupied 11 days later. Black dots indicate sample depths at each station included in the composite plots

