
Fig. 4.
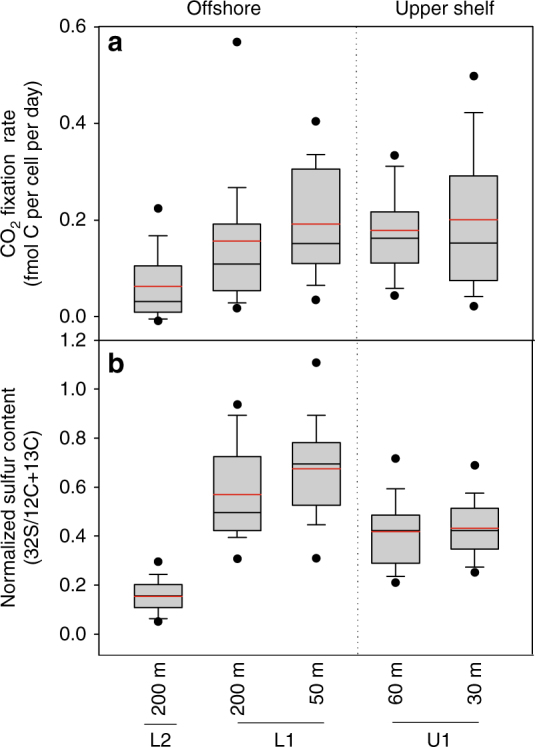
SUP05 single-cell activity and sulfur content of ETSP-SUP05 bacteria. a CO2 fixation rates based on 13C-bicarbonate uptake into SUP05 cells. b Normalized single-cell sulfur content. The mean (red line) and median (black line) are indicated. The boxes represent the distribution of data with 95th and 5th percentiles and outliers are indicated by the black circles. Standard deviations bars are shown. The number of SUP05 cells analyzed at station–depths were as follows: U1–30 m (48 cells); U1–60 m (59 cells); L1–50 m (35 cells); L1–200 m (32 cells); and L2–200 m (23 cells)