Figure 2.
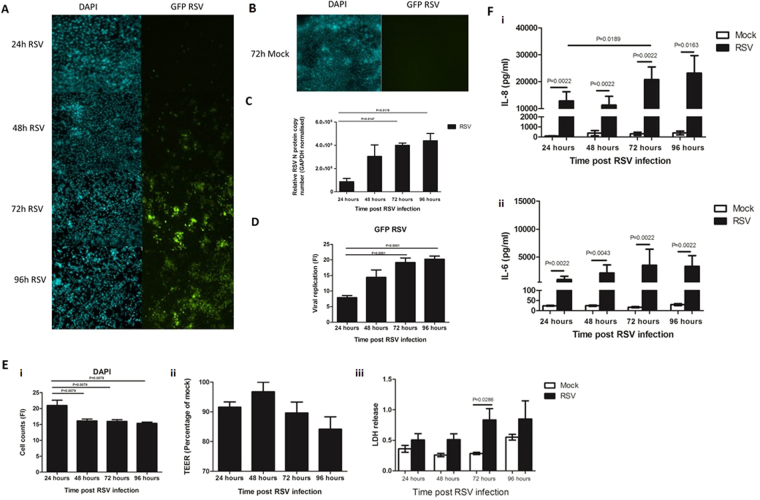
Characterisation of our RSV infection model. (A) Representative microscopy images of RSV infected A549 epithelial monolayer with green fluorescence (GFP) and DAPI fluorescence over time. (B) Representative microscopy images of mock infected A549 monolayer with GFP and DAPI fluorescence at 72 h post infection. No GFP fluorescence is observed in these controls. (C) Quantitative analysis of the images shown in Fig. 2A. GFP and DAPI fluorescence intensity was quantified using ImageJ, at least 4 images were used for each time point. Bars show mean ± SEM. Statistical significance is shown. (D) Quantitative RT-PCR of RSV viral load in A549 cells as measured by N protein copy number. Viral load was measure in A549 cells infected with GFP RSV over time. Bars show mean ± SEM of n = 3 biological repeats. Statistical significance is shown. (E) The damage caused to the A549 epithelium following RSV infection for 24, 48, 72 and 96 hours as determined by (i) number of epithelial nuclei/cell remaining attached to the membrane based on DAPI staining/0.045mm2 (ii) TEER as measured using a voltohmmeter, data is represented as the percentage relative to the mock infected control (iii) Lactate dehydrogenase (LDH) release as measured in supernatant of AECs post RSV infection. Statistical significance is shown. Bars show mean ± SEM of at least n = 3 biological repeats. (F) CXCL8 (IL-8) and IL-6 concentrations in supernatants post RSV and mock infection of A549 cells as measured by ELISA. Bars show mean ± SEM of n = 3 biological repeats. Statistical significance is shown. For all other comparisons P > 0.05.

